Visualizing Graphs in 3D with WebGL

Head of Product Innovation & Developer Strategy, Neo4j
6 min read
While looking for efficient graph visualization libraries for large scale rendering, I came across 3d-force-graph, a really neat wrapper around three.js for graph visualization. Check out that repository after reading this, they have many more examples and settings to explore.
I was already aware of and impressed by three.js, especially the 3d and WebGL capabilities. I had seen and done some graph visualization using it years ago, but 3d-force-graph packages three.js nicely with a Graph API and adds useful options to quickly get good looking results.
If you want to try the different approaches directly, I put them into a GitHub Repository with live examples using the RawGit Service to serve HTML pages and assets directly from the repository.
Datasets
I started by using the Game of Thrones interaction graph, that my colleague Will Lyon wrote about here and which you can create yourself by running :play got in your Neo4j Browser. The GitHub repository uses the demo.neo4jlabs.com server which hosts a Game of Thrones dataset under the readonly user/password/database: “gameofthrones”.
Besides the basic graph of characters, it also has interaction “weights” on the relationships and the guide adds some additonal metrics like a pageRank property that we want to use in the visualization.
To take it to a larger dataset, you can explore the ICIJ’s Paradise Papers database, which is available as a Neo4j Sandbox, using this visualization.
But let’s get started.
Accessing the Data
As I outlined in the first article of this series, Neo4j’s Cypher over the binary Bolt protocol, can pull up to 1M records per second over the wire, enough to feed our graph visualization interactively with enough data.
In our experiments, we use again the Neo4j Javasscript Driver to query the graph for data and render it in the 3d-graph.
Please note that the JS driver uses a custom Number object, which we have to turn into JS integers with value.toNumber() and if you’re sending integer values use neo4j.int(value).
Thee following, interactive pages load 5000 relationships from your graph at bolt://localhost, you might need to set auth (default is user: neo4j, password: test)
Basic Loading
Basic loading here we’re just using the node ids because that is the fastest way to extract the graph structure.
Load relationship list
MATCH (n)-->(m) RETURN id(n) as source, id(m) as target LIMIT $limitWe load that data using the Javasscript driver as demonstrated before and transform it into a data structure in gDatathat 3d-force-graph understands.
const driver = neo4j.driver("bolt://localhost", neo4j.auth.basic("neo4j", "test"));
const session = driver.session({database:"neo4j"});
const start = new Date()
session
  .run('MATCH (n)-->(m) RETURN id(n) as source, id(m) as target
        LIMIT $limit', {limit: neo4j.int(5000)})
  .then(function (result) {
We need one array with links from a source id to a target id. And one array for nodes containing our data to render. In the initial example that will just be the ids. We compute those id’s from the unique Set of source and target ids of our relationship-list.
const links = result.records.map(r =>
   { return {source:r.get('source').toNumber(),
             target:r.get('target').toNumber()}});
session.close();
console.log(links.length+" links loaded "+(new Date()-start)+" ms.")
const ids = new Set()
links.forEach(l => {ids.add(l.source);ids.add(l.target);});
const gData = { nodes: Array.from(ids).map(id => {return {id:id}}),
                links: links}
Then we just need to use that to initialize our 3d-graph.
ForceGraph3D()(document.getElementById('3d-graph')).graphData(gData)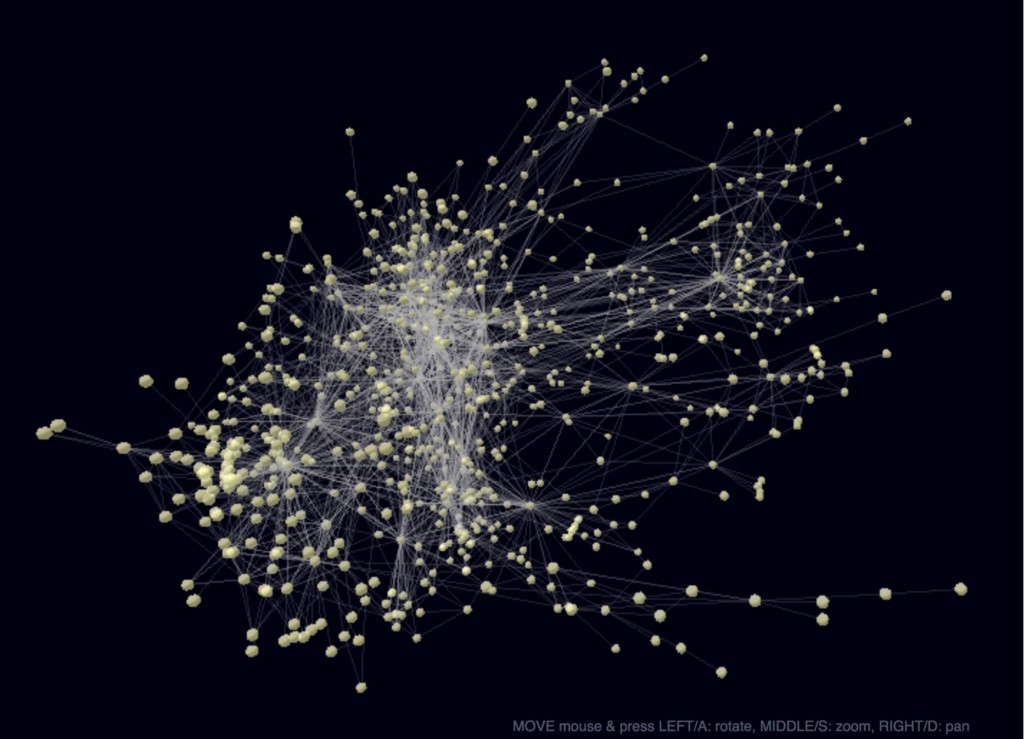
The full code example can be seen and read here:
Incremental Loading
With incremental loading, we can add each row from the query result to the graph as it arrives. Especially with large results, that improves the responsiveness of the visualization and the user immediately sees feedback that they can interact with. Also it’s fun to watch the new nodes and relationships popping into existence.
The main difference is that we now create the 3d-graph upfront and then update its graphData with each arriving row, adding our new entries using the Array spread operator.
result.records.forEach(r => {
   const { nodes, links } = Graph.graphData();
   const link={source:r.get('source').toNumber(),
               target:r.get('target').toNumber()}
   Graph.graphData({
        nodes: [...nodes, { id:link.source }, { id: link.target}],
        links: [...links, link]
    });
});
This is best shown in action, so test it out below.
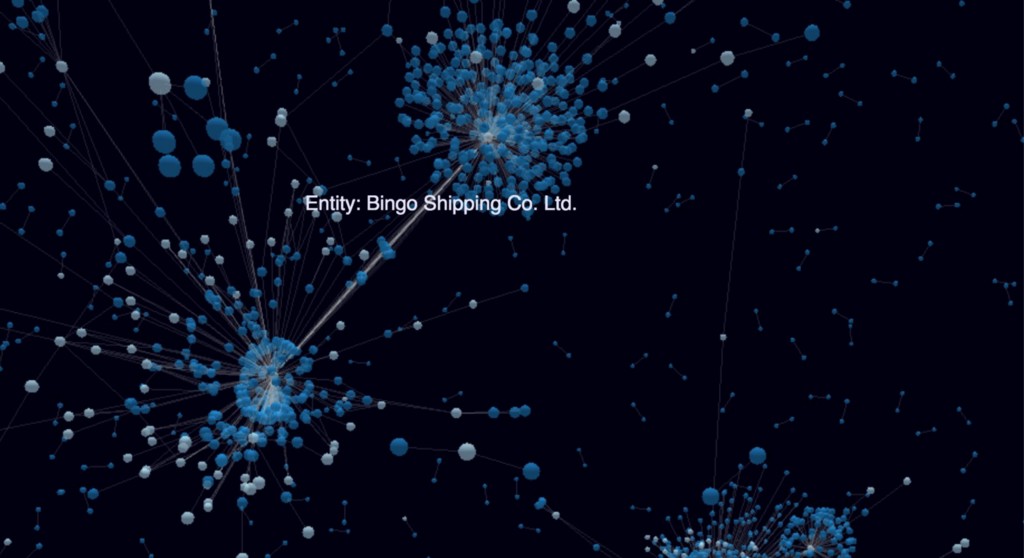
Color and Caption
Of course a bland graph excites no one, so let’s some color and information. That requires us to provide that info for the nodes, so besides the id, we also provide a label for coloring and a caption for each node. color by label and text caption on hover
MATCH (n)-->(m)
RETURN
  { id: id(n), label:head(labels(n)), caption:n.name } as source,
  { id: id(m), label:head(labels(m)), caption:m.name } as target
LIMIT $limit
Fortunately 3d-force-graph comes with some hand option for auto-coloring based on an attribute, so we don’t have to handle colors or palettes manually. For the caption we just provide text to render in the nodeLabel callback and for feedback we also change the cursor while hovering over a node.
const Graph = ForceGraph3D()(elem)
              .graphData(gData)
              .nodeAutoColorBy('label')
              .nodeLabel(node => `${node.label}: ${node.caption}`)
              .onNodeHover(node =>
elem.style.cursor = node ? 'pointer' : null);This time, we use the Paradise Papers as an example as it has more different labels (five) than the Game of Thrones interaction graph. Something that becomes quickly apparent in the 3d graph visualization are the clusters that form around officers (people in management roles for shell companies) and intermediaries (law firms and banks creating shell companies).
Weights for Node and Relationship Sizes
After running a graph algorithm like PageRank on our data, the nodes get a rank score as a weight. The relationships of the GoT graph already had interaction weights, both of which we can now render in addition to colors and captions.
We also want to color relationships by type. We use log(weight) for relationships as they would grow too thick otherwise.
So we return then as additional information from our graph query.
MATCH (n)-[r]->(m)
RETURN { id: id(n), label:head(labels(n)), caption:n.name,
         size:n.pagerank } as source,
       { id: id(m), label:head(labels(m)), caption:m.name,
         size:m.pagerank } as target,
       { weight:log(r.weight), type:type(r)} as rel
LIMIT $limit
We use the size attribute for nodes with the nodeVal method and the weight on relationships with the linkWidthmethods. For coloring the relationship-type we call linkAutoColorBy.
const Graph = ForceGraph3D()(elem)
              .graphData(gData)
              .nodeAutoColorBy('label')
              .nodeVal('size')
              .linkAutoColorBy('type')
              .linkWidth('weight')
              .nodeLabel(node => `${node.label}: ${node.caption}`)
              .onNodeHover(node =>
                      elem.style.cursor = node ? 'pointer' : null);
Particles & Cluster Coloring
If we also ran a community detection or clustering algorithm like Louvain, we can use the cluster information for coloring nodes and relationships instead, making immediately visible to which cluster an entity belongs. So we return the louvain property as community (or cluster) entry for nodes and for relationships return the “smaller” community number as the one the relationship belongs to.
MATCH (n)-[r]->(m)
RETURN { id: id(n), label:head(labels(n)), community:n.louvain,
         caption:n.name, size:n.pagerank } as source,
       { id: id(m), label:head(labels(m)), community:n.louvain,
         caption:m.name, size:m.pagerank } as target,
       { weight:r.weight, type:type(r),
         community:case
           when n.community < m.community then n.community
           else m.community end} as rel
LIMIT $limit
As an additional, fancy feature we replace the solid relationships with a particle stream instead, making them less obstructive.
In this case we use the original weight property, (not log(weight)) as it represents the number of interactions, i.e. the number of particles traveling between the two characters.
const Graph = ForceGraph3D()(elem)
              .graphData(gData)
              .nodeAutoColorBy('community')
              .nodeVal('size')
              .linkAutoColorBy('community')
              .linkWidth(0)
              // number of particles
              .linkDirectionalParticles('weight')
              .linkDirectionalParticleSpeed(0.001) // slow down
              .nodeLabel(node => `${node.label}: ${node.caption}`)
              .onNodeHover(node =>
                      elem.style.cursor = node ? 'pointer' : null);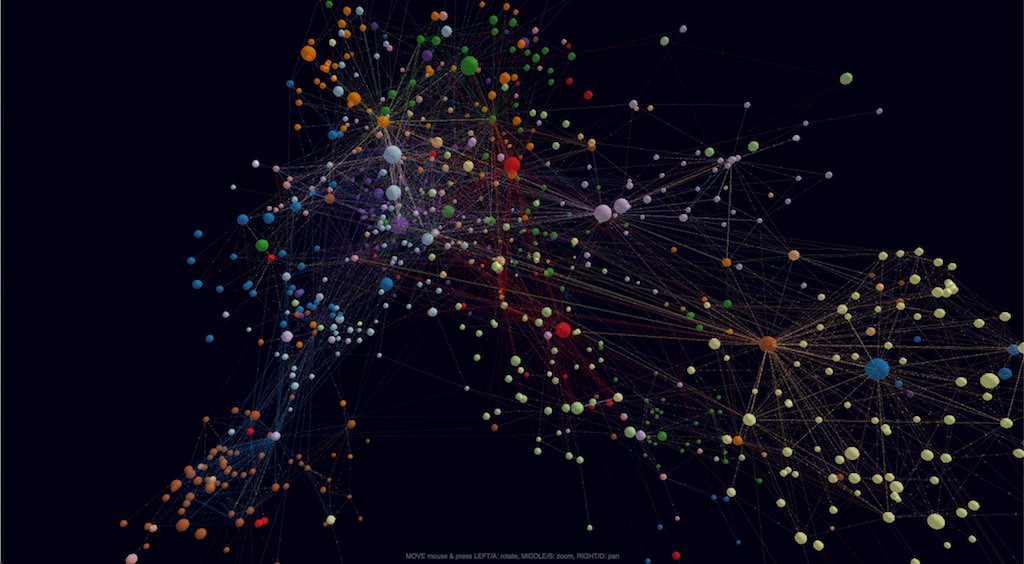
That’s it for today from me.
There are many more options in 3d-force-graph, please check it out, play around and let me know in the comments what you came up with.
Big thanks to its author, Vasco Asturiano for creating such a great and easy to use library.
Visualizing Graphs in 3D with WebGL was originally published in Neo4j Developer Blog on Medium, where people are continuing the conversation by highlighting and responding to this story.
Share Article


Explore
Related Articles

Hey LLM, you’re using OPTIONAL MATCH wrong. Here’s the Cypher that actually works.