Log manager
Introduced in 1.3
The log manager allows you to filter, sort and browse query logs from each of your monitored DBMS instances. At first, an aggregated Summary view of queries performed within the last 15 minutes is displayed.
|
If you are not seeing any log messages, or if you see a message saying that logs are not enabled, please refer to Neo4j instance requirements and Configure agent. |
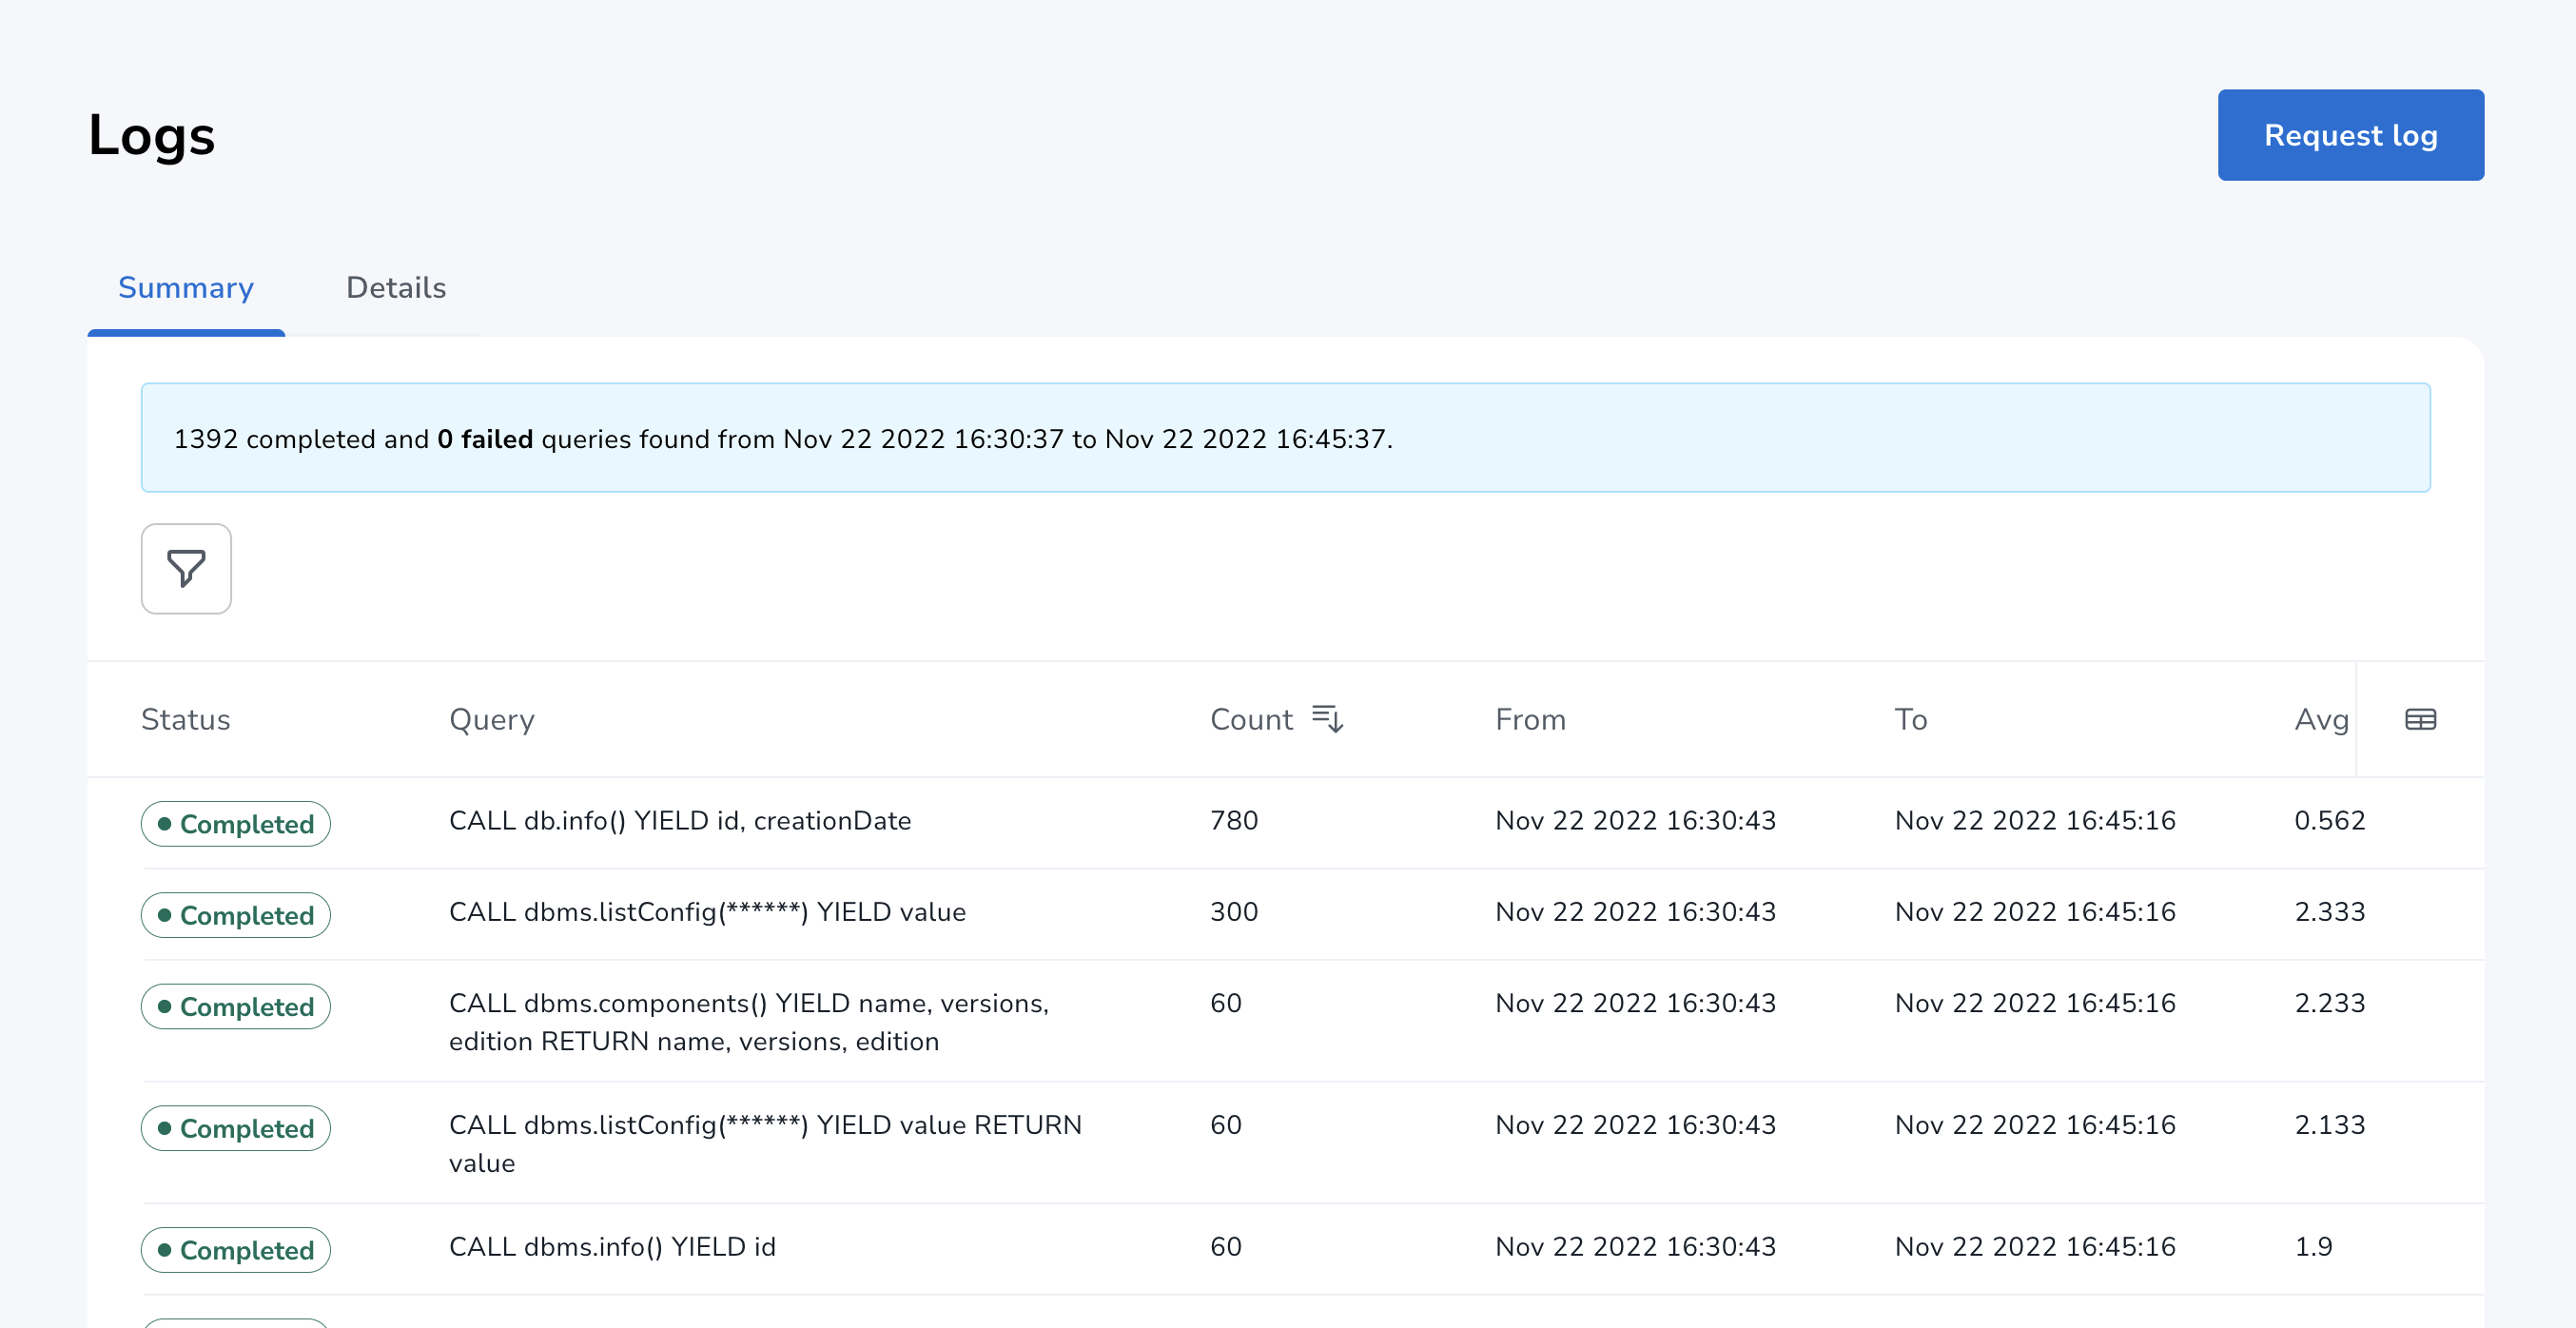
It is possible to view individual query executions under the Details tab, or by hovering over an aggregated query and clicking the arrow button that appears to the right.
Individual queries are retained for 24 hours, after which they are aggregated into one-hour blocks. You can still view information, such as average time to execute the query, and how many times it was executed within the time window. After 7 days, the queries are further aggregated into 24-hour blocks and retained for an additional 30 days.
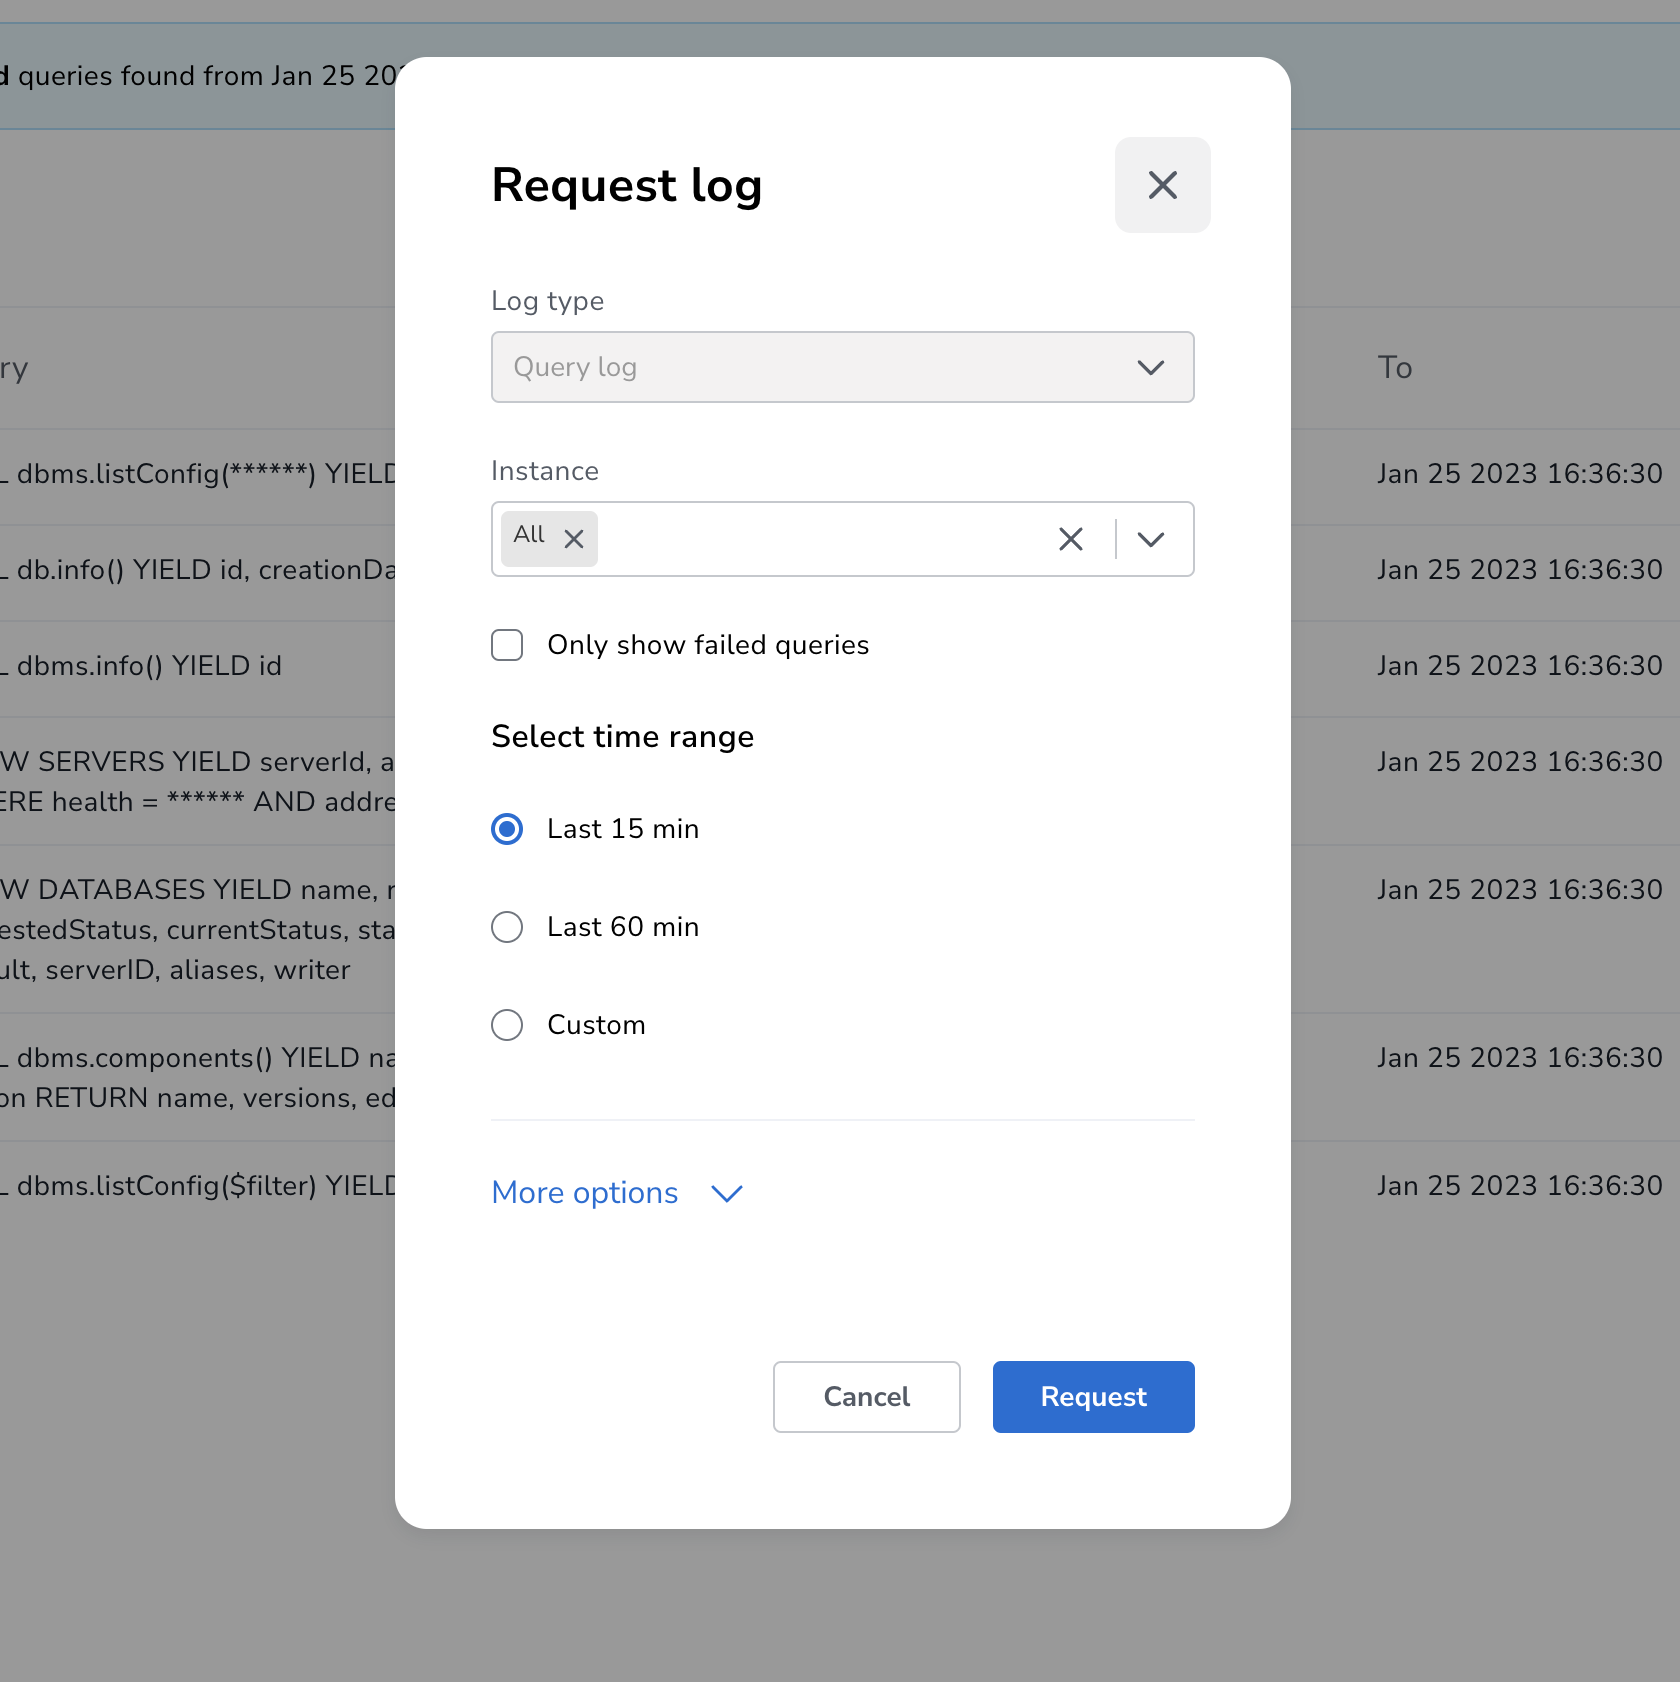
For more fine-grained filtering and custom time windows, use the Request log modal dialog.