Metric manager
The metrics page offers rich charts and tables with data related to your monitored DBMSs. The time window for displayed data can be switched on top left of the metrics page.
|
To allow efficient metric storage, metrics data older than 3 days is aggregated to hourly summary. |
The "Show Resources" button in the Host tab and Instance tab shows a table with static data for managed DBMSs, like the number CPU cores of the system (physical and logical) and memory/disk capacities.
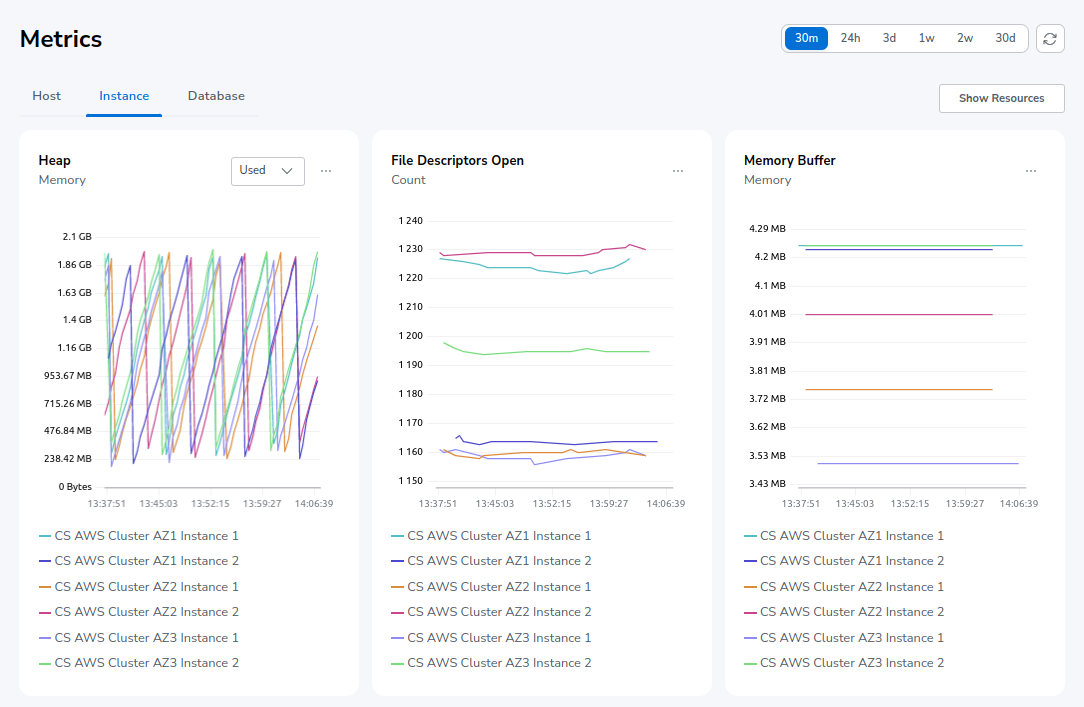
Charts allow for zooming/panning by clicking and specifying the area of interest by dragging the cursor. To reset zoom in the chart you can double click inside the chart. Zoom/reset zoom affects all charts displayed on the page to allow investigating different metrics in a specific time range.
Metric list
-
Host metrics (per host)
-
CPU Usage System
-
CPU Usage User
-
CPU Idle
-
Free Memory and Total Memory
-
Used Memory and Total Memory
-
Swap Used and Limit
-
-
Instance metrics (per Neo4j instance)
-
Heap Used
-
Heap Committed
-
File Descriptors Open
-
Memory Buffer
-
Page Cache Hit Ratio
-
Page Cache Usage Ratio
-
Disk Used (/Data)
-
Disk Used (/Metrics)
-
Disk Used (/Logs)
-
Disk Used (Home)
-
Disk Used (/Transactions)
-
Bolt Connections Running
-
Bolt Connections Idle
-
Bolt Connections Closed
-
Bolt Connections Opened
-
Garbage Collection Young Gen
-
Garbage Collection Old Gen
-
-
Database metrics (per Neo4j database)
-
Active Read Transactions
-
Active Write Transactions
-
Committed Transactions
-
Last Transaction ID
-
Peak Concurrent Transactions
-
Transaction Rollbacks
-
Allocated IDs (Properties)
-
Allocated IDs (Relationships)
-
Allocated IDs (Nodes)
-
Replan Events
-
Disk Used (/Data)
-
Disk Used (/Transactions)
-
Store Size (Nodes)
-
Store Size (Properties)
-
Store Size (Relationships)
-
Store Size Total
-
Store Size Database
-
Node Count
-
Relationship Count
-
Checkpoint Events (Count)
-
Checkpoint Events (Cumulative Time)
-
Last Checkpoint (Duration)
-
Setting metric thresholds
Introduced in 1.6
To inform administrators about noticeable changes in metrics by showing alerts and sending notifications, NOM supports defining metric thresholds directly from the metrics chart. This can be accomplished using "Threshold" menu item of the "…" menu of the metric chart.
In the example below, a threshold of 80% was added in the chart for "Host CPU Usage" metric.
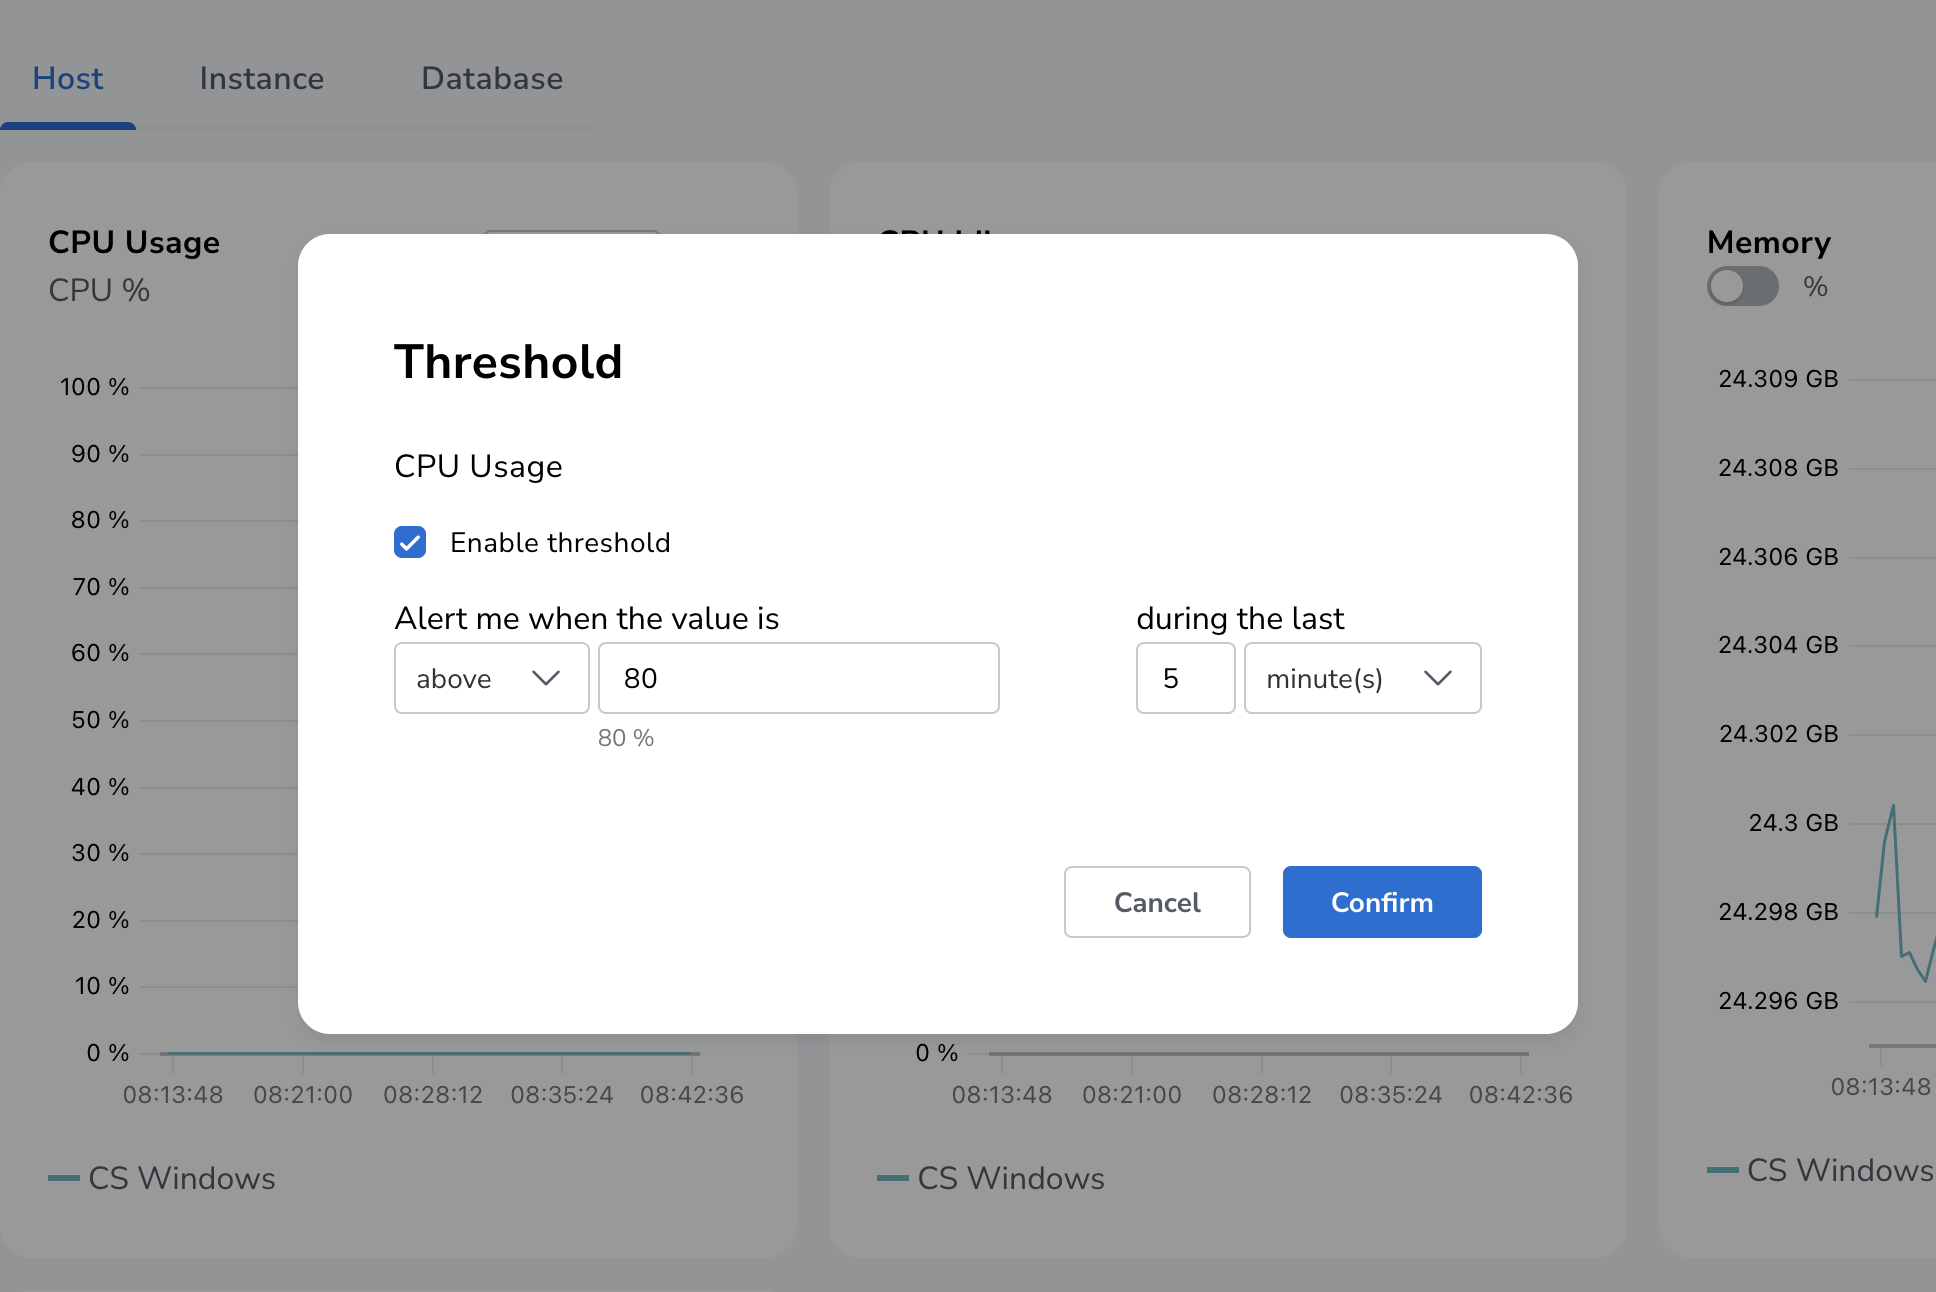
After confirming the threshold dialog:
-
The corresponding condition, used to trigger alerts and notifications, is created and can be managed using the Conditions tab (see Managing conditions).
-
If the metric value exceeds the threshold during the defined grace period (5 minutes), the condition evaluates to
true, causing NOM to trigger an alert and (if configured), send notifications (see Notifications). -
The metric chart displays the defined threshold in the chart as a dashed red line.
To disable the threshold, open the threshold dialog and uncheck the "Enable threshold" checkbox. This removes this condition from the system.
|
Currently, some logical groups of metric charts (like "Disk used" and "Store size" chart groups) can only have a single threshold defined, which is then valid for every chart in the group. |