Overview of Graph Algorithms
Graph Analytics and Algorithms
In nature, we can observe the formation and evolution of many social and physical networks. Every person is a member of a friendship network. We can represent the human brain as a network of neurons and synapse connections. Research papers form a citation network if we follow their citations. Every city has a transportation network that includes public transport and infrastructure.
Graph analytics, also known as network analysis, focuses on the study of relationships in real-world networks. Due to the sheer volume of data, the insights are sometimes hard to spot with the naked eye. Graph algorithms are so exciting because they are the methods we use to understand real-world networks. They help us uncover the essence of complex systems by analyzing their connections.
We can observe and retrieve local graph patterns with query languages such as Cypher. The term graph algorithms usually refer to more global and iterative analysis, where, for example, we want to learn the overall community structure of a graph.
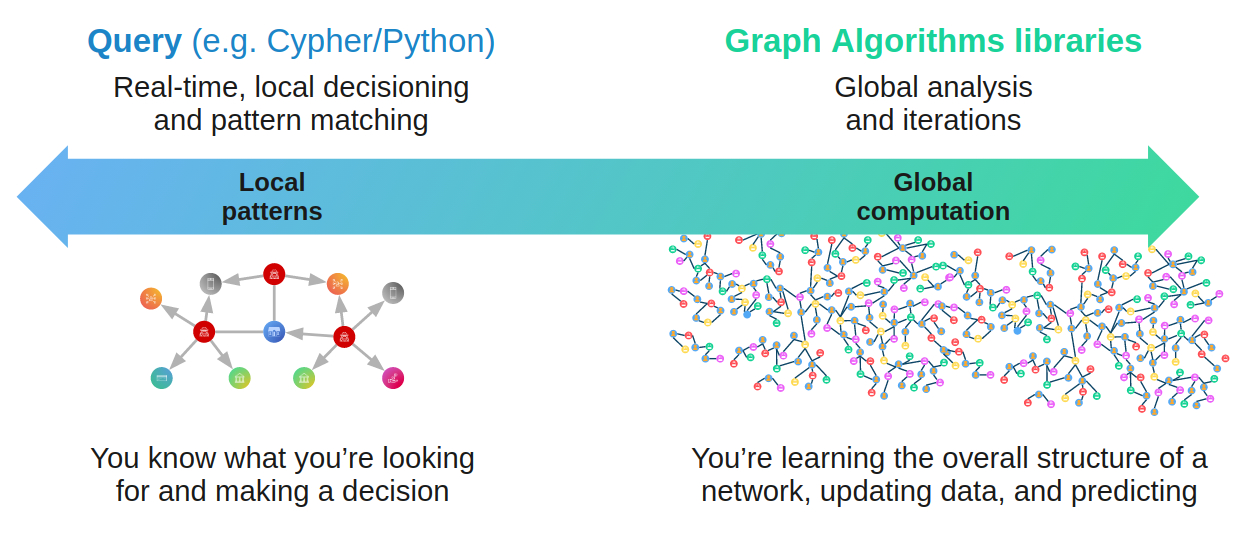
As an example, if we wanted to count the number of neighbors for a given node, we could fetch that information with Cypher. However, if we are interested to learn how influential those neighbors are, given their position in the global network, we would use graph algorithms.
When not to use graphs
Note when not to use graph and graph algorithms!
In general, very organized data that follows a regular schema, and has relatively few connections between its data elements does not warrant graph specific storage and computation.
Here are some examples:
-
Questions with just a few connections or flat (not nested).
-
Questions solved with specific, well-crafted queries.
-
Simple statistical results (sums, averages, ratios).
-
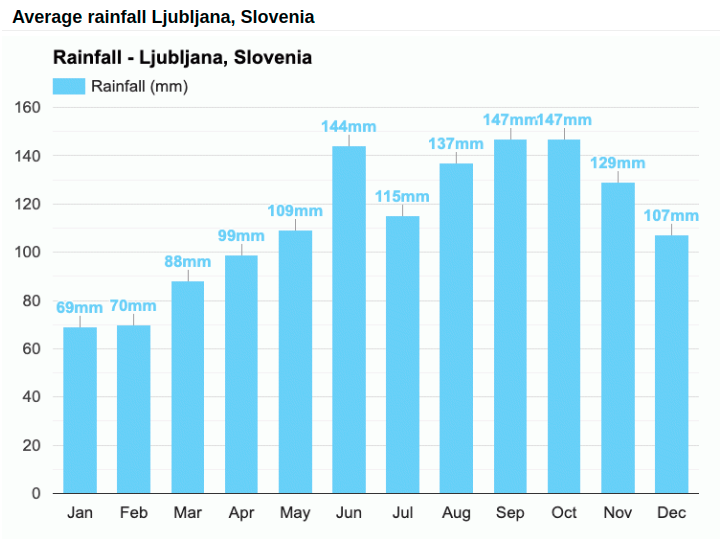
Example: Regular reporting based on defined criteria and well-organized data:
-
Image from https://www.weather-atlas.com/en/slovenia/ljubljana-climate. |
Average rainfall calculation is an example of a simple statistical result, where no graph analytics is required. |
Graph Structure
A graph consists of nodes (also called vertices), which are connected by relationships (also called edges or links).
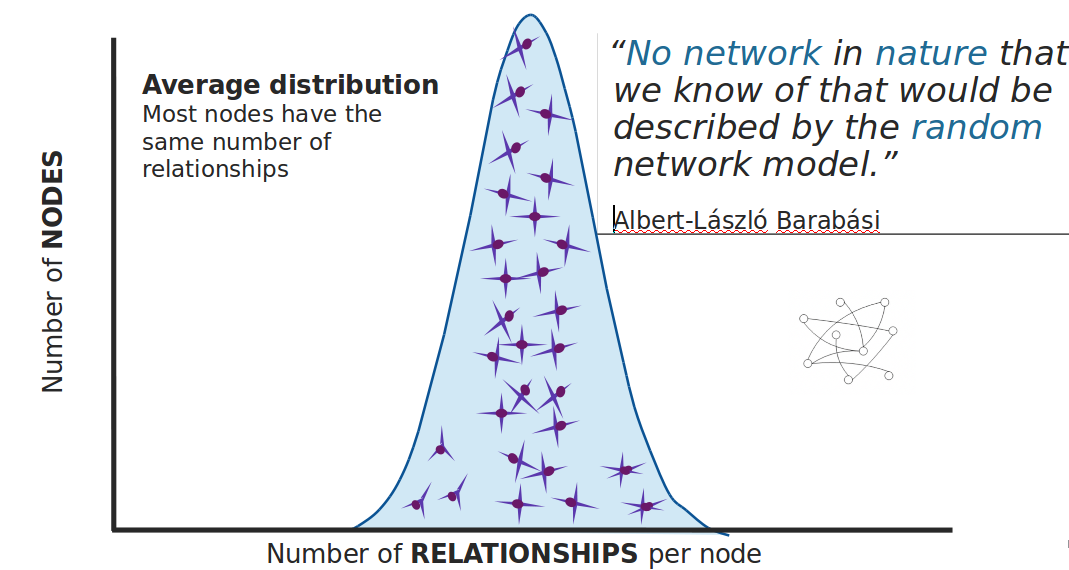
Random network
|
In a completely average distribution of relationships per node, a random network is formed with no hierarchies. All nodes have the same probability of being attached to any other node. However, average distribution is only valid when we are dealing with a set of independent observations. |
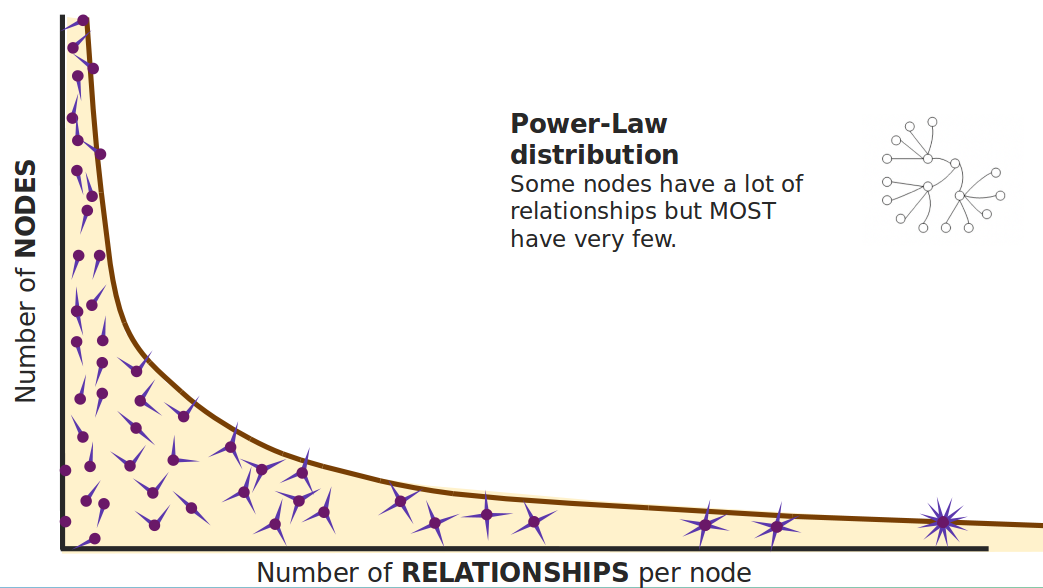
Structured network
|
Highly connected and, therefore, dependent observations do not adhere to average distribution. The relationship distribution in most real-world networks follows the Power-Law. A well-known example is the Pareto distribution or the "80/20 rule". Originally it was used to describe a situation where 20% of a population controls 80% of the wealth. |
Structure and density
|
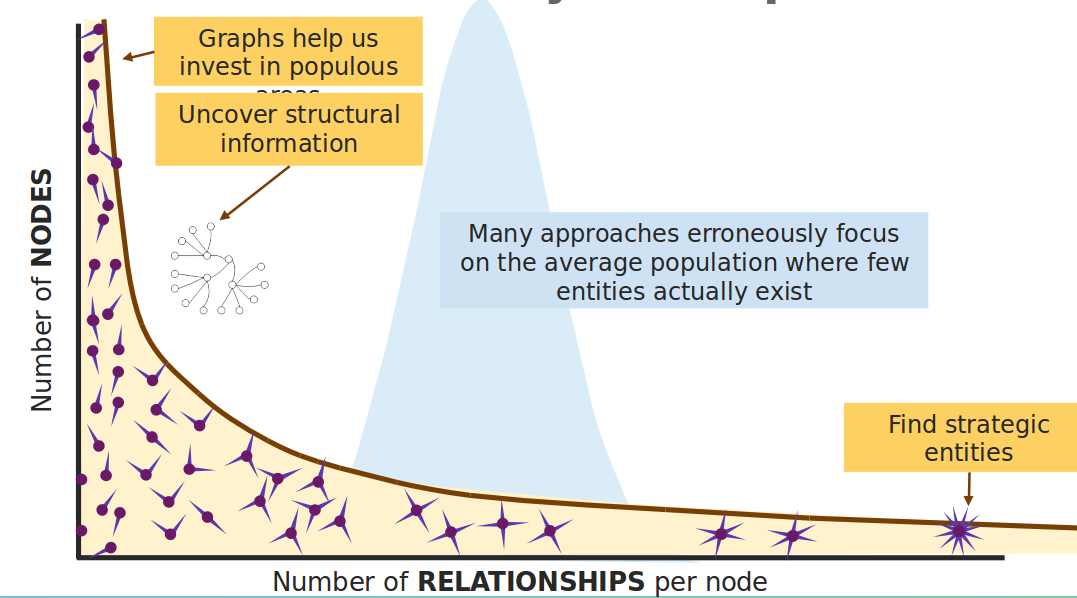
Graph analytics is a collection of methods that help us determine strategic entities, uncover structural information, and calculate the flow of information in a given network. |
Understanding graph complexity
|
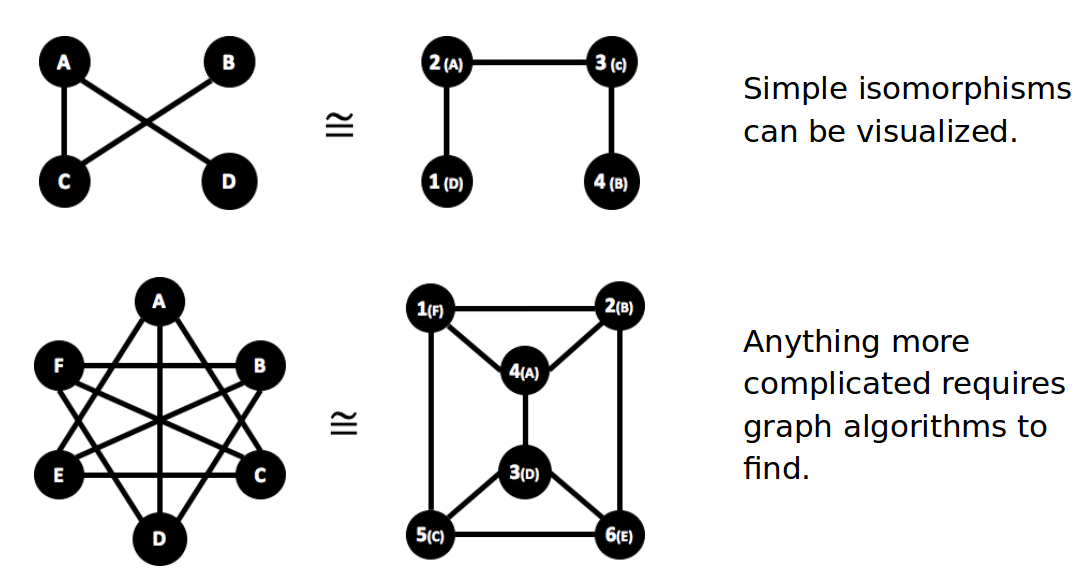
Simple networks can be visually inspected to gain insights. Due to the enormous amount of data generated today, real-world networks can contain billions of nodes and relationships. As we cannot visually inspect networks of those sizes, we turn to graph algorithms to help us make sense of the data. |
What do people do with graph algorithms?
There are a number of real-world use-cases, where graph algorithms are applied.
Explore, plan, measure |
Machine learning |
Find significant patterns and plan for optimal structures. |
Use the measures as features to train an ML model. |
|
|
Score outcomes and set a threshold values for a prediction |
Propagation pathways
This is a very practical example of analyzing Propagation paths; trying to understand the routes taken by network failure:
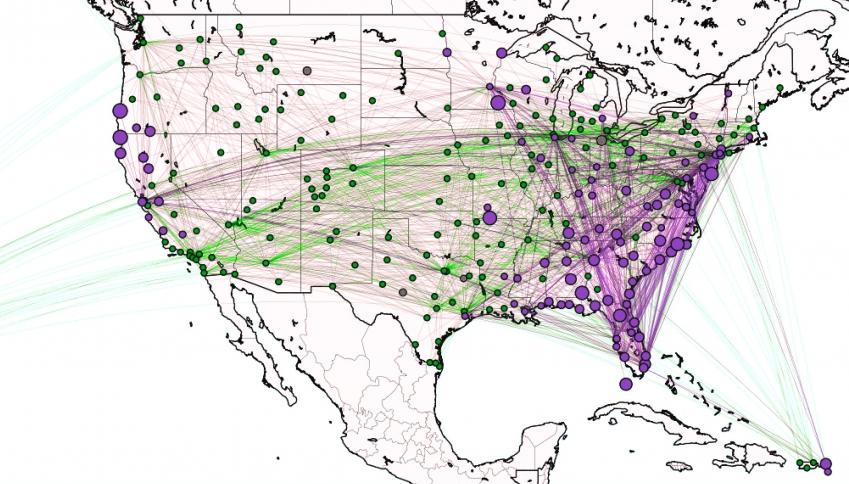
This data is from a severe US 2010 Airline congestion failure, with the purple dots showing serious delays and the greens dots doing ok. If we had a time sequence, we would see the cascading, rippling failures, and the key connections that spread the delay from east to west. Of course, this is just one example. This could very well be an IT network where you are trying to contain an infection or an electrical grid. Or perhaps you want to encourage the spread of something, like information, and you will need to understand the best path to promote.
Flow and dynamics
We could be looking at flow and dynamics of a network to understand its capacity and optimize movement of resources.

This Telecom example shows the complexity in just one challenge, Least Cost Routing: We have to call from point A to B, but there are various routes we might choose. We need to consider costs by the time of day, quality service levels, and even priority calling to be factored in when choosing the optimal route.
Evaluating flow options is very common for planning in general, and we could just as well be looking at the flow for shipping, maybe getting your goods to a customer in the most efficient manner. Or perhaps you need to provide services for emergencies – and you need to understand the time impacts of dynamic changes to flow.
Group resiliency
Group resilience and influence are a fascinating area of study because we are looking at things like how a group might break apart or how you might bring them together, the stability over time, and the influence points.
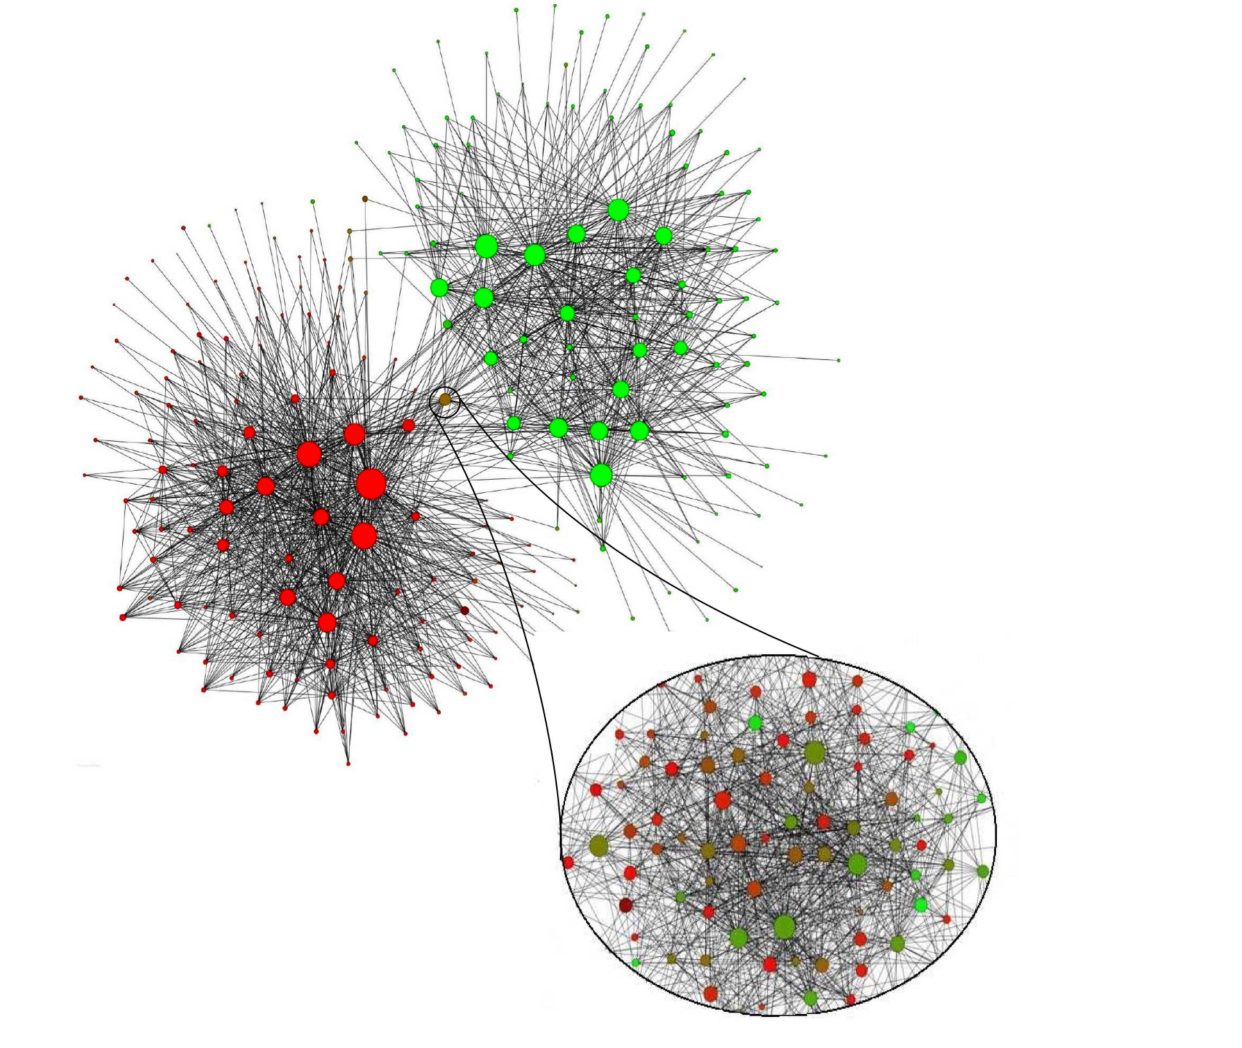
This diagram is from a fascinating study of a Belgian telecom network with the nodes in red being calls from French speakers and the nodes in Green being calls from Dutch speakers. The first thing you notice is the high call volume within their own language groups, except for that small little group that is amplified. In that cluster, there was no significant preference to call mostly speakers of the same language. This very group acts as a communication bridge between the other majority French and Dutch speakers. And if we wanted to bring these two groups closer together, we might focus on communications within that bridge group.
This kind of analysis is done for all sorts of scenarios such as fraud, perhaps we are looking for a key middle man, or in biology to understand how to target a disease better.
Types of graphs
Graphs come in various shapes and forms. For example, on Twitter, you can follow someone, but they do not necessarily follow you back. On other social media platforms, a friendship link exists only if both parties agree to it. Sometimes, the strength of a relationship plays an important factor. We might also differentiate between different types of nodes and various kinds of relationships in a network.
Directed versus undirected graphs
|
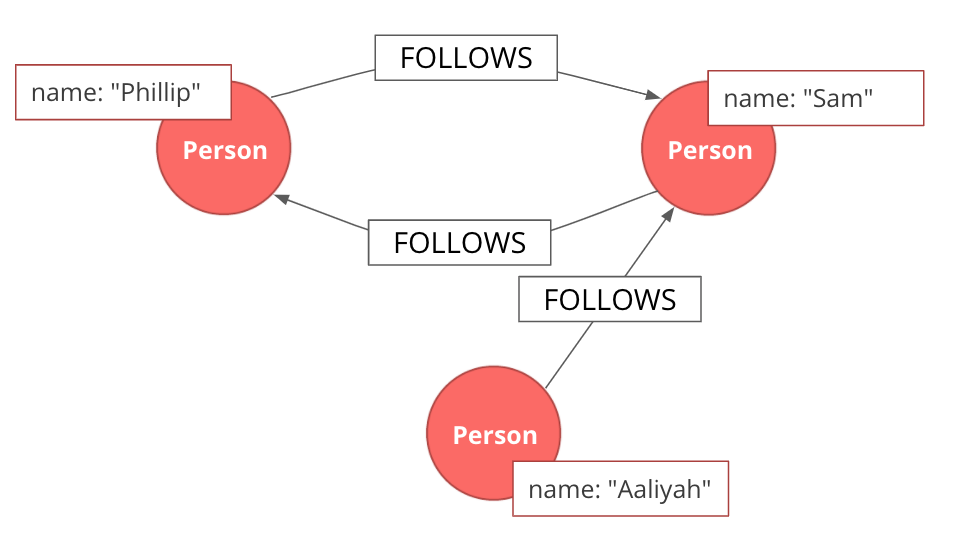
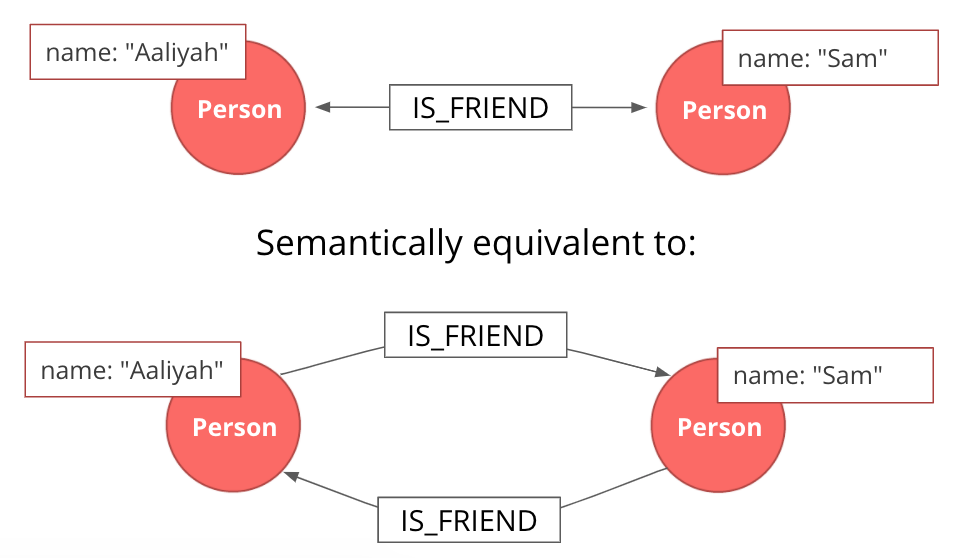
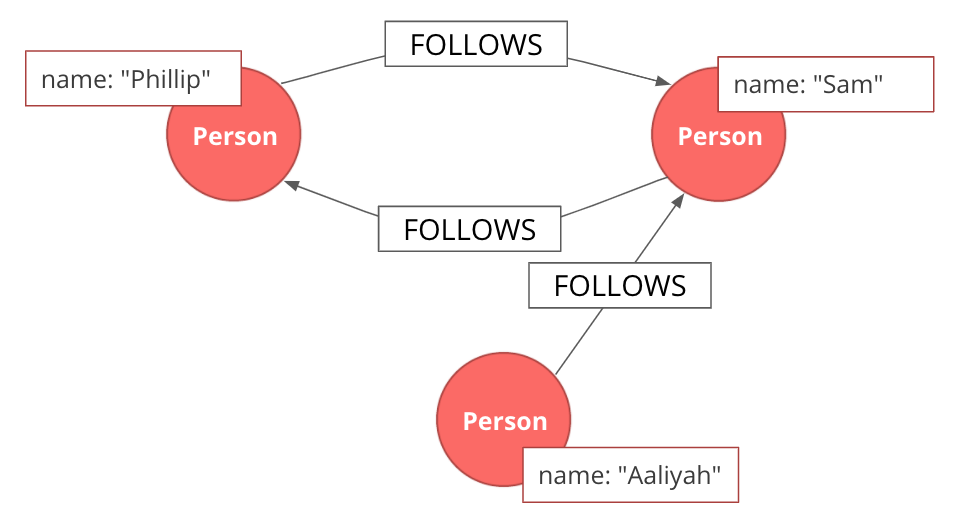
In the case of a directed graph, the direction of a relationship does matter. In our example, both Aaliyah and Phillip’s feed will contain posts from Sam. On the other hand, Sam’s feed will contain only Phillip’s posts as he does not follow Aaliyah. |
|
In an undirected graph, a single relationship represents a link between nodes in both directions. For example, Aaliyah and Sam can either be friends or not. A scenario where Aaliyah is friends with Sam, but Sam is not friends with Aaliyah, is not possible. An undirected relationship can also be represented as two directed relationships, where one relationship points in the opposite direction of another. |
Unweighted versus weighted graphs
|
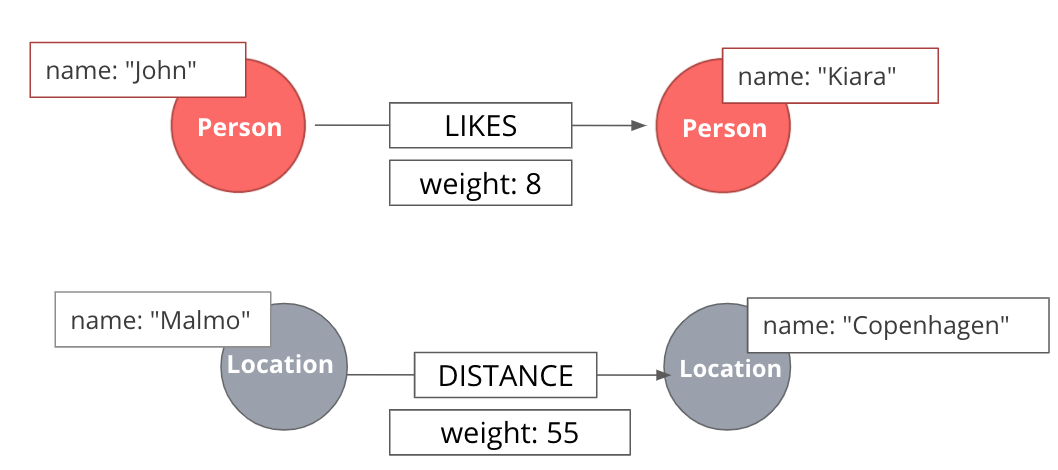
In an unweighted network, a relationship between a pair of nodes has no associated cost or weight assigned to it. Therefore, no notion of the strength of a relationship exists. |
|
When dealing with weighted networks, we assign each relationship a weight representing the strength or cost of traversing the relationship. The weight must be a number. A typical application for using a weighted network is a transportation network, where we are searching for the shortest weighted path between a pair of nodes. |
Depending on the domain, sometimes a higher weight value is better, while other times, a smaller weight value is preferred.
Monopartite versus multipartite graphs
|
A monopartite graph consists of a single set of nodes. In Neo4j terms, it means we have nodes with a single label. This is an example of a monopartite graph, where we have only Person labels for nodes. |
|
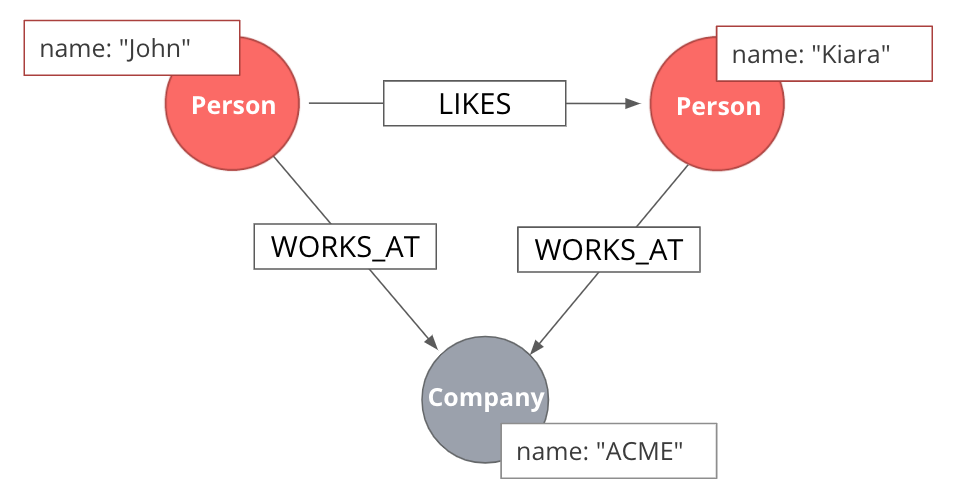
A multipartite graph consists of many independent sets of nodes. In Neo4j terms, it means we have nodes with many labels. This is an example of a bipartite graph, where we have Person and Company labels for nodes. |
Centrality measures and community detection algorithms are primarily designed to run on monopartite graphs. Usually, it is a mistake to run centrality algorithms on a bipartite graph. To solve this obstacle, we can easily infer a monopartite graph from a bipartite graph.
Monopartite projection
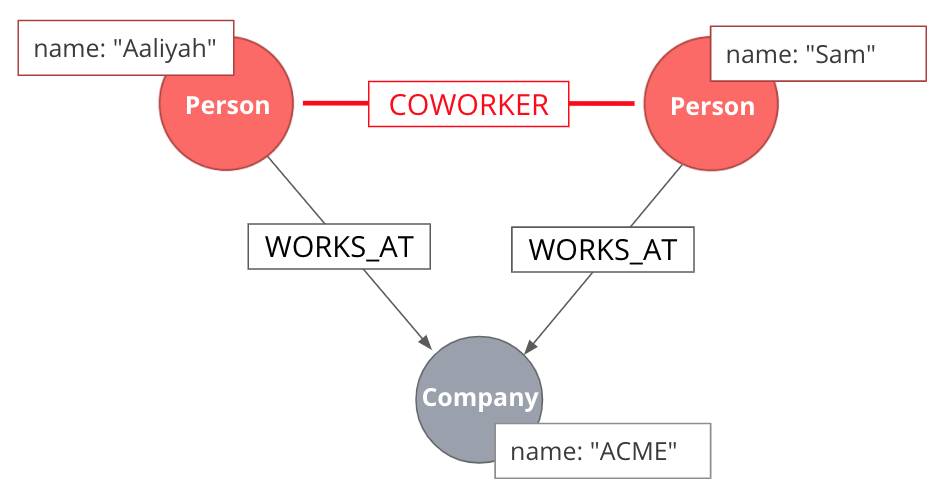
This is an example of a monopartite projection, where we infer that two persons are coworkers if they are working in the same organization. A monopartite projection can be understood as a process of translating indirect relationships to direct relationships. In real-world graph analysis, we are often dealing with multipartite networks, and so, the monopartite projection is a common step of the graph analytics workflow.
Multigraph versus simple graph
A simple graph permits only a single relationship between a pair of nodes, whereas a multigraph is a graph that allows multiple connections between a single pair of nodes.

Those relationships can be of different types, but we can also have many relationships of a single type between a specific pair of nodes. The Graph Data Science Library features support for multigraphs, as well as procedures for transforming multigraphs to single graphs.
Types of graph algorithms
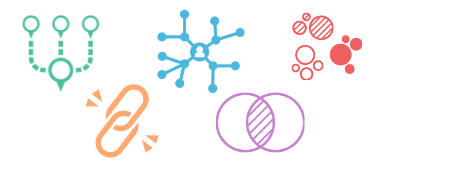
Various graph problems require different graph algorithms to solve them. Here are some of the graph algorithm categories studied today:
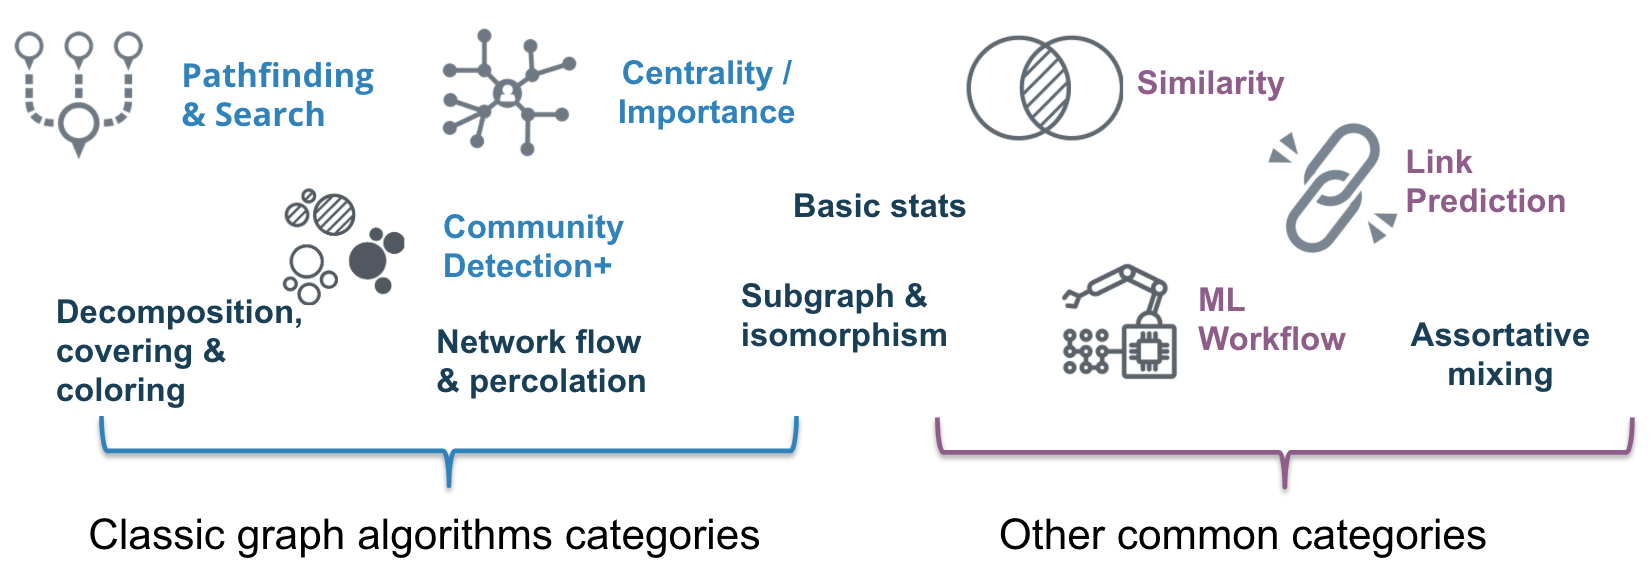
We will take a closer look at the categories of graph algorithms available in the GDSL.
Community detection (Clustering) algorithms
|
Community detection algorithms are used to find clusters of communities that the nodes form in a network. They are also used to examine how tightly-knit some of those communities are. This category includes popular algorithms – such as Connected Components, Label Propagation and Louvain Modularity – where the connections reveal tight clusters, isolated groups, and various structures. This information helps predict similar behavior or preferences, estimate resilience, find duplicate entities, or simply prepare data for other analyses. |
Centrality algorithms
|
Centrality algorithms are used to find the most influential nodes and their role in a network based on the graph topology. These algorithms are used to infer group dynamics such as credibility, rippling vulnerability, and bridges between groups. The most famous algorithm in this category is PageRank. |
Pathfinding algorithms
|
Pathfinding algorithms are usually used to find the shortest path between nodes in a network. The most common algorithm is the Dijkstra algorithm. They are used to evaluate routes for uses such as physical logistics and least-cost call or IP routing. |
Similarity algorithms
|
Similarity algorithms are used to find similar nodes in a network based on graph topology or their properties. This approach is used in applications such as personalized recommendations and developing categorical hierarchies. The most common algorithms in this category are Jaccard Similarity and Cosine Similarity algorithms. They can also be used to infer a monopartite projection of a bipartite graph. |
Link prediction
|
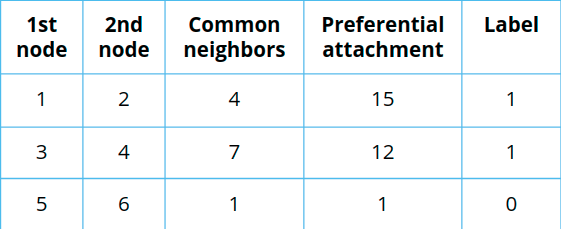
Link prediction algorithms help determine the closeness of a pair of nodes. They consider the proximity of nodes, as well as structural elements, to predict unobserved or future relationships. Preferential Attachment is included in this class of algorithms that has many applications, from drug re-purposing and estimating collaboration to criminal investigations. |
Check your understanding
Question 1
What are some practical use cases for using graph algorithms?
Select the correct answers.
-
Machine learning applications.
-
Grouping users in a telecommunications network.
-
Optimizing the routing of services in a dynamic network architecture.
-
Analyzing the result of a flight delay on a network of flights.
Summary
You have learned a lot about graphs, their structure, and how graph algorithms are applied to solve real-world problems.
Need help? Ask in the Neo4j Community
