Introduction to Graph Data Science library
Neo4j for Graph Data Science
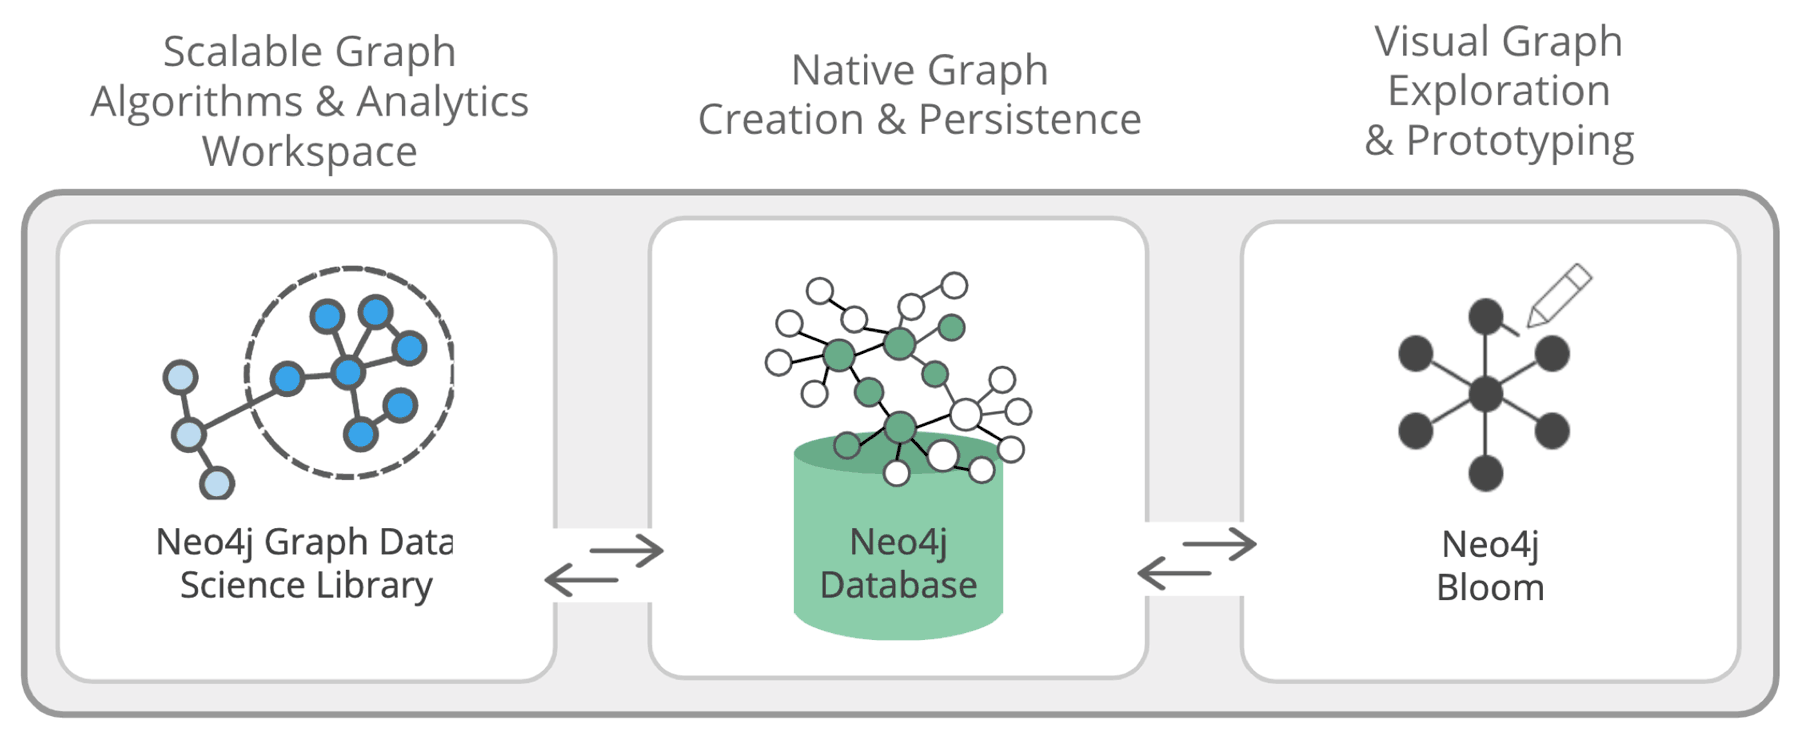
Neo4j for Graph Data Science is a toolbox that combines a native graph analytics workspace and graph database with scalable graph algorithms and graph visualization for a reliable, easy-to-use experience. This framework enables data scientists to confidently operationalize better analytics and machine learning models that infer behavior based on connected data and network structures.
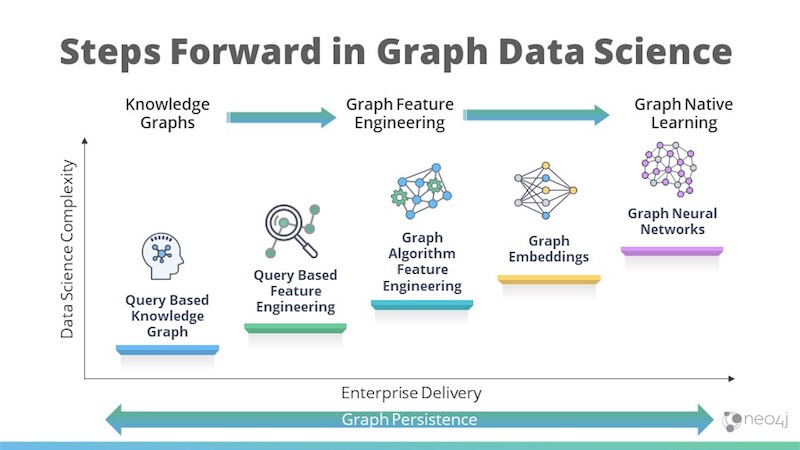
Steps for using Graph Data Science
This toolbox aims to provide support and ease of use for all the steps in Graph Data Science analysis.
Neo4j Database
-
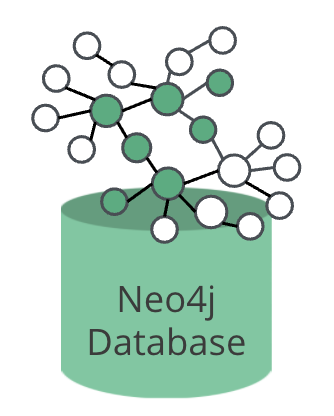
Neo4j is a native graph database, built from the ground up to leverage not only data but also data relationships.
-
Neo4j connects data as it is stored, enabling queries never before imagined, at speeds never thought possible.
Neo4j Bloom
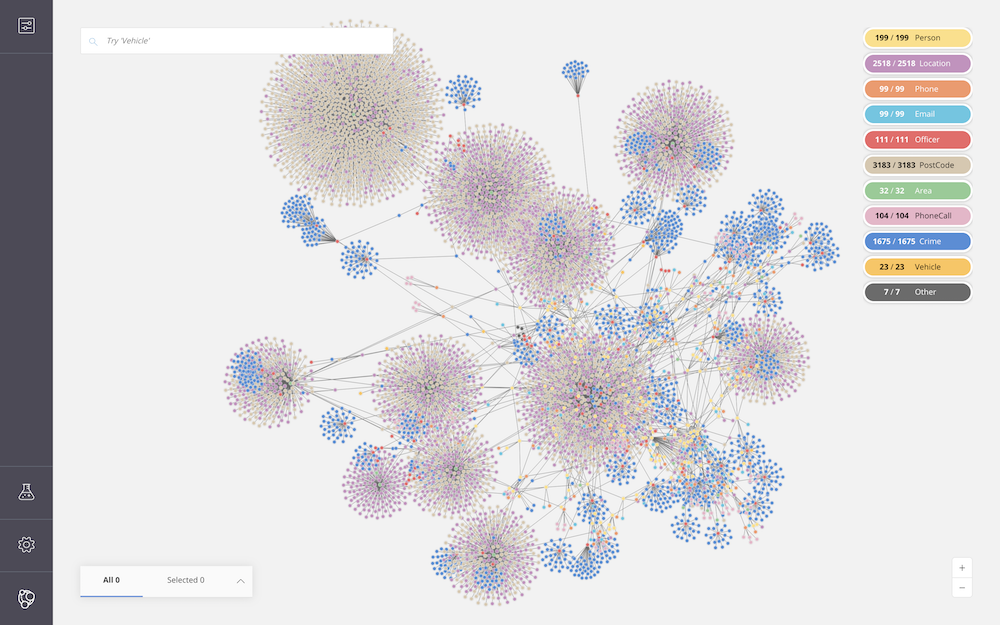
Neo4j Bloom is an easy-to-use graph exploration application for visually interacting with Neo4j graphs.
Bloom gives graph novices and experts the ability to visually investigate and explore their graph data from different business perspectives. Its illustrative, codeless search-to-visualization design makes it the ideal interface for fostering communication between peers, managers and executives, where they can share the innovative work of their graph development and analytics teams.
Graph Data Science Library
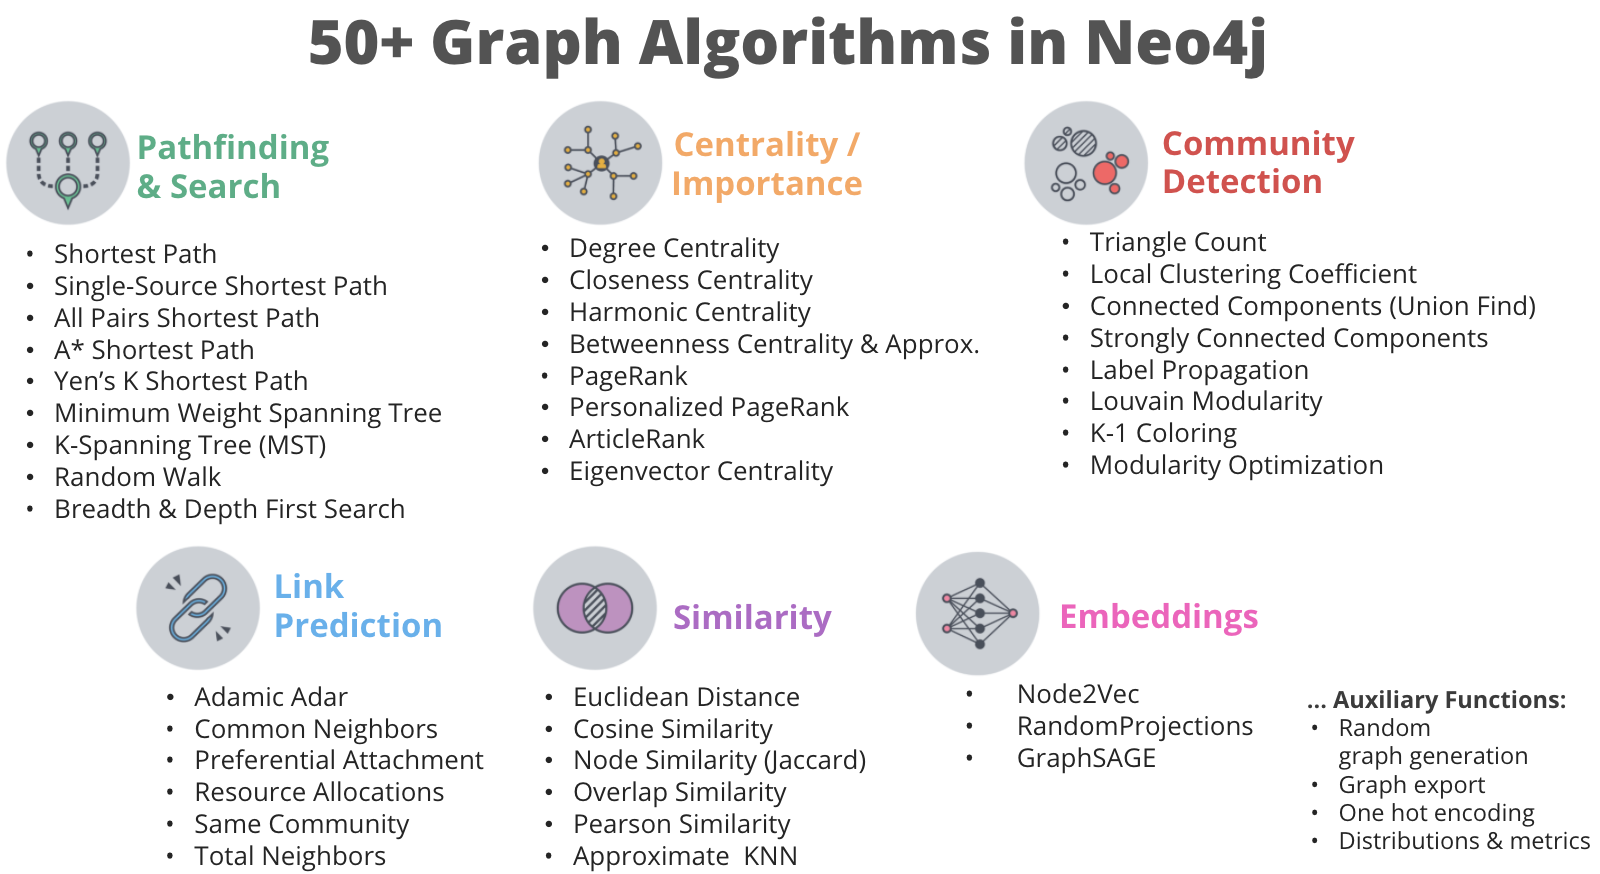
The Neo4j Graph Data Science Library (GDSL) contains many graph algorithms. The algorithms are divided into categories which represent different problem classes:
-
Path Finding - these algorithms help find the shortest path or evaluate the availability and quality of routes.
-
Centrality - these algorithms determine the importance of distinct nodes in a network.
-
Community Detection - these algorithms evaluate how a group is clustered or partitioned, as well as its tendency to strengthen or break apart.
-
Similarity - these algorithms help calculate the similarity of nodes.
-
Link Prediction - these algorithms determine the closeness of pairs of nodes.
-
Node Embeddings - these algorithms compute vector representations of nodes in a graph.
These graph algorithms help to effectively answer questions about your data’s connectivity or topology, or generate new and highly predictive features for your existing ML pipelines. At this writing, the the GDSL contains more than 50 graph algorithms.
Three tiers of graph algorithm maturity
Algorithms exist in one of three tiers of maturity:
Production-quality
Indicates that the algorithm has been tested with regards to stability and scalability. Algorithms in this tier are prefixed with gds.<algorithm> and are supported by Neo4j.
Beta
Indicates that the algorithm is a candidate for the production-quality tier. Algorithms in this tier are prefixed with gds.beta.<algorithm>.
Alpha
Indicates that the algorithm is experimental and might be changed or removed at any time. Algorithms in this tier are prefixed with gds.alpha.<algorithm>.
Check your understanding
Summary
In this chapter you have familiarized yourself with the Neo4j for Graph Data Science toolkit.
Need help? Ask in the Neo4j Community