
Using Aura Graph Analytics to Model NYC Subway Disruptions
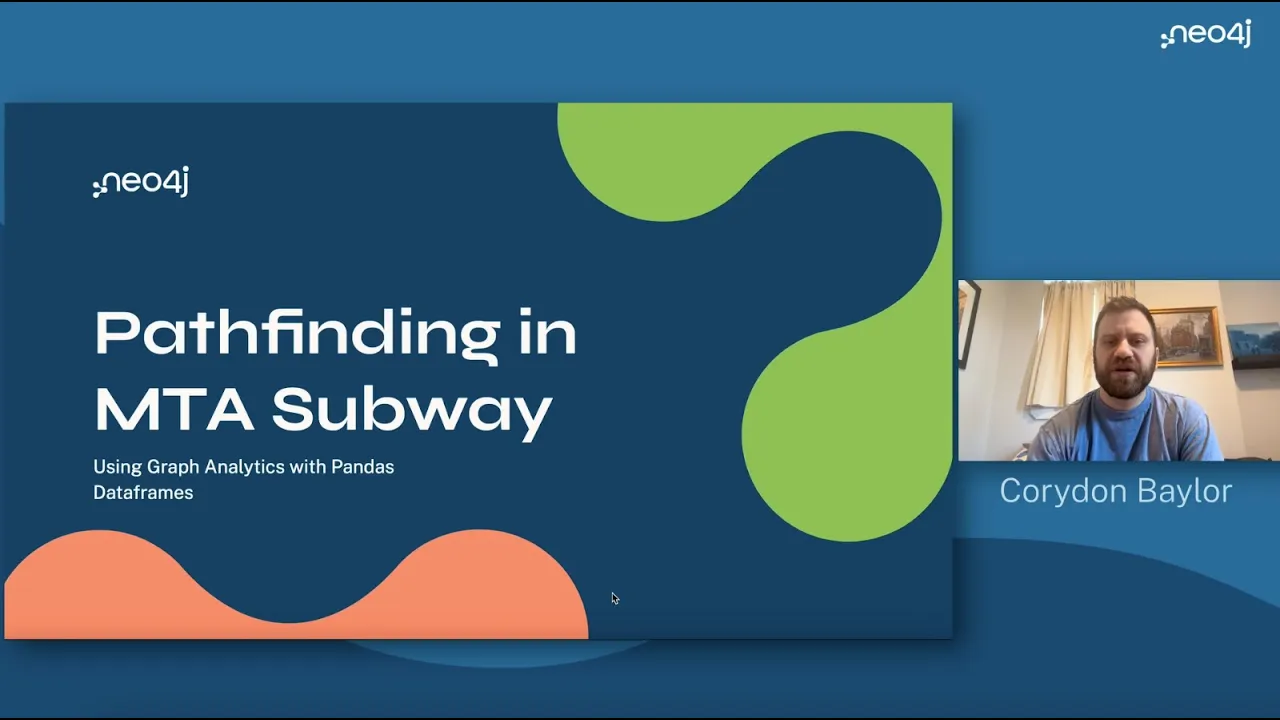


Powerful Network Modeling with Aura Graph Analytics. In this short video, we’ll explore how to simulate real-world disruptions—like a closed NYC subway station—using Aura Graph Analytics
We’ll walk through an example where the NYC subway is modeled as a graph of stations and connections, and then subjected to pathfinding analysis using Dijkstra’s algorithm. We show how a single station closure can ripple through the network and how Aura Graph Analytics can quickly identify alternative routes.
Using Neo4j Aura Graph Analytics capabilities, you'll see how to:
- How to import and clean transit data
- How to create directed graph projections
- How to run Dijkstra’s shortest path algorithm to calculate least-hop or least-cost routes
- How to simulate disruptions (like a station closure) by excluding specific nodes from your projection
- How this approach scales to real-world applications like supply chain resilience, manufacturing flow, and logistics optimization
- Run graph algorithms at scale — twice as fast as open-source tools
Resources mentioned
AuraDBData modeling & import
- Watched Duration: 1:00:42

- Watched Duration: 7:29

- Watched Duration: 1:19:45

- Watched Duration: 57:07

- Watched Duration: 41:34

- Watched Duration: 7:29

- Watched Duration: 34:33

