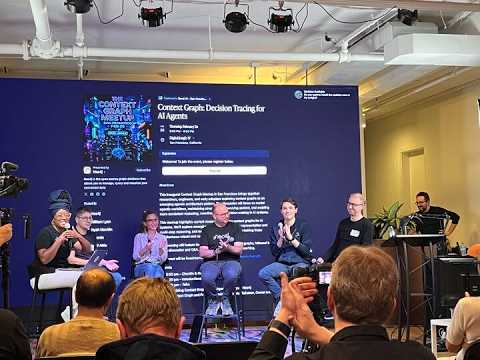
Capturing the Full Conference Experience with Context Graphs
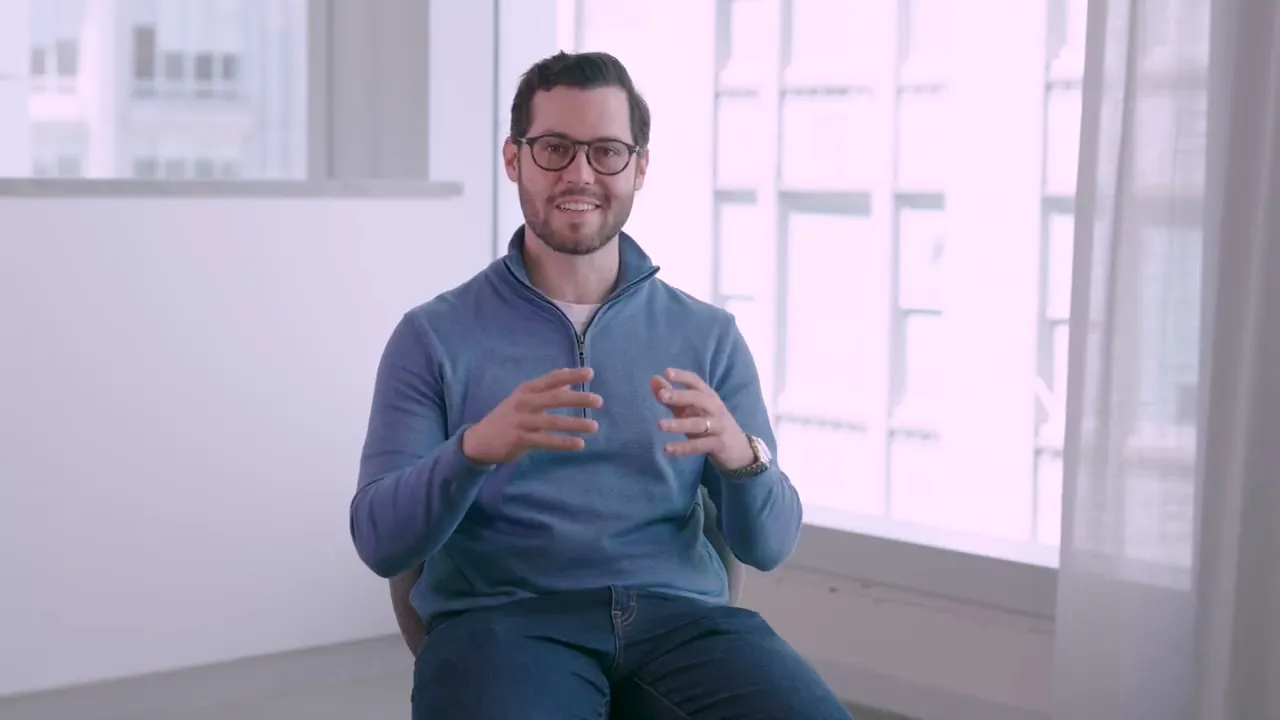


For Andres Espinosa, conferences don’t have to end when the event wraps up. With Alani Connect, his team has created a digital room that extends the conference experience throughout the year, using graphs to connect attendees, vendors, keynote presentations, and other content. The idea is simple: conferences are packed with valuable conversations, but there’s no way to be everywhere at once. By using context graphs, Andres and his team can curate all that information and personalize the experience for each attendee, helping people discover the conversations and connections they may have missed.
At Graph Gathering, Andres is excited to learn from other practitioners who are putting graphs to work in real-world applications. He describes his team as still being in an experimental phase with graphs, but they’ve already become incredibly important to the Alani Connect product. For him, the event is a chance to compare notes, hear about different use cases, and better understand how other companies are moving from experimentation toward production.
What makes the gathering especially valuable for Andres is the opportunity to learn directly from both industry practitioners and the Neo4j team. He’s interested in the latest technologies Neo4j is developing, but just as importantly, he wants to hear how other teams are solving problems, what challenges they’ve encountered, and what they’ve learned along the way. As Alani Connect continues exploring context graphs for conference curation, these conversations are helping Andres and his team refine their approach and imagine what’s possible when a conference can become a personalized, always-on experience.
- Watched Duration: 23:29
- Watched Duration: 3:18

- Watched Duration: 20:46

- Watched Duration: 15:29

- Watched Duration: 19:22

- Watched Duration: 20:23

- Watched Duration: 28:15