Why Every Forged-Parts Tariff Answer Is Stale by Monday.

Senior Field Engineer, Neo4j
15 min read
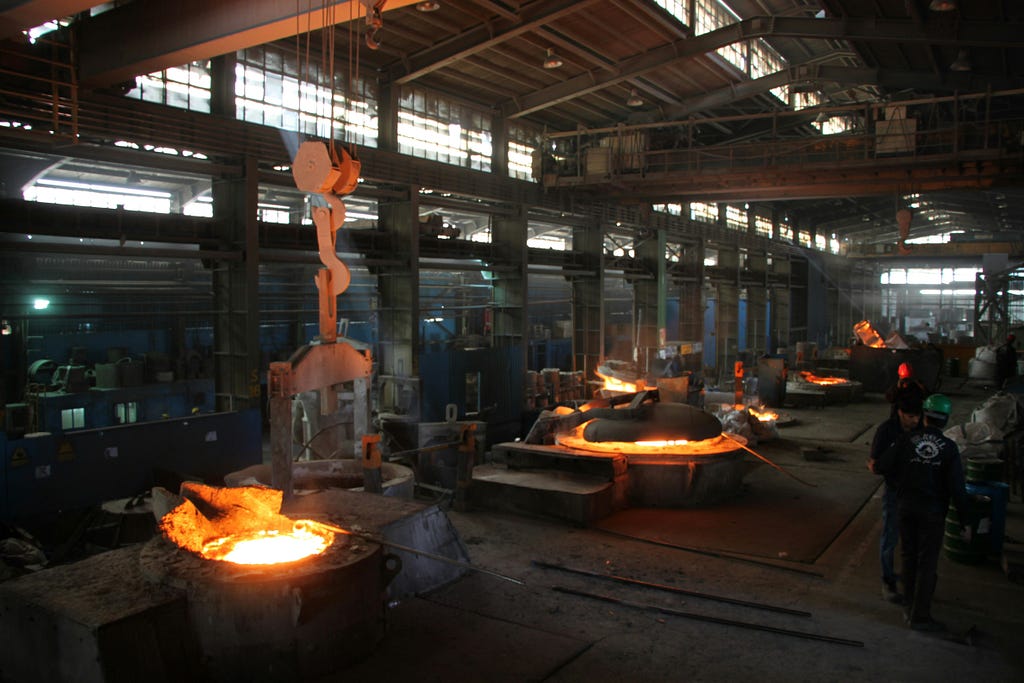
The data and knowledge exist. The answer doesn’t.

Authors
– François BENSID, CEO Graphicient
– Nicolas ROUYER, Manager Solutions Engineering, South EMEA, Neo4j
It’s a Monday morning. Over the weekend, Washington moved a tariff again, and a procurement lead gets a one-line question: “What is our exposure on our forged parts?”
It sounds like a report you run once. It is not. The answer lives in no single place, and it keeps moving
A single critical forged part depends on a chain no one sees in full:
- the material and where its metal was melted,
- the forger and its qualified alternatives,
- the programs that fly it,
- its customs classification,
- and the documents that trace all of this. The facts exist.
They are scattered across the bill of materials, the material certificates, the supplier records and the customs data, each system built for its own purpose. And the rule that decides the answer also keeps moving, so the question has a new answer every time it changes, and an analysis delivered in six weeks is incorrect by the design.

Has it not been solved already?
It has, three times over, each attempt more structured than the last. And each one ends in the same place.
> The expert and the spreadsheet. Someone who knows the parts rebuilds the sourcing tree by hand, part by part, all the way back to the raw material. Weeks of patient work, already out of date the day it was finished.
> The consultants. The effort gets a method, a team and a budget. A study lands, thick and confident, answers the question once, then ages in a drawer. The next time the rule moves, you pay again from zero.
> The tool way. The analysis finally gets industrialised into dashboards. More robust, more shared, but built for the questions known the day they were designed, and slow to change when a new one arrives.
Three levels of maturity, one shared logic: each freezes an answer to one angle and one moment. Each step adds structure, none removes the root problem, so the organisation goes round in circles: the rule moves, the answer decays, and the effort starts again one level up. The tool way is where most of the effort goes today, so it deserves a closer look.
What today’s tools do, and where they stop
The tool way, BI (Business Intelligence), is the workhorse, and its limit is structural, not a matter of performance. A view is a question cast into a schema: it answers its own angle beautifully. But a part’s tariff exposure was rarely the angle a dashboard was built for, so the buyer who asks it hears one of two things:
- “the data does not exist that way” (false, it exists, it is simply filed under another point of view), or
- “give us six weeks for a new build” (one more viewpoint, walled in its turn).

BI does not scale in the number of angles, it scales in the number of projects. The systems of record hold the facts, but each stores them under its own single structure. They were never meant to answer a question that crosses all of them at once.
And even a correct-looking query can mislead when no one sees the path behind it. Reviewing an early version of this very case, we found one card that had silently sliced its result to the first rows, drawing 120 of the 235 exposed parts and dropping 115 without a word. Another announced that all 610 missing documents were found when it actually counted a few dozen. The lesson is not that the tools are bad. It is that a number with no visible path behind, cannot be trusted, and most tools hide the path.
So the real problem is not a missing report. It is that every available answer is frozen to one angle and one moment, on data whose gaps everyone treats as a reason to wait. Nearly half of the traceability documents behind these parts are missing, about 610 of 1,240. “Our data is incomplete, we cannot start”, is the reflex.
There is another way to answer, and it does not decay. It does not start with a table. It starts with the business.
The method
It starts with the business, not a table
Take 3 steps: Model the domain, Connect the sources, and Ask.
No view to build in between, and none to watch go stale. A view freezes one angle; we use a graph instead of a limited view: a graph formalizes “things and the connections between them,” and that abstraction turns out to be general enough to model an enormous range of real-world systems while giving access to a mature set of algorithms for reasoning about them.
The graph stores the facts and their links, so every angle is already there and always up to date because it reads the sources directly. The model is at the core: it is the shared ground where the viewpoints of procurement, quality, programs and compliance meet, each expressed in its own terms, all anchored to the same data. That is the whole shift, so it is worth watching it happen, step by step, on the Graphicient platform.


1. Model the domain
The business user creates an object, names it, and defines its attributes. It stays simple: a forged part has a part number, a criticality, and a family; a material has an alloy and a country of melt; a supplier has a type and a financial health. Nothing technical, just the properties the business already knows each thing by.

Then they connect these objects with semantic relationships, the way the business itself understands the links. No database knowledge, no technical schema, just the sentences a buyer would say out loud: a part is made of a material, a material is melted in a country, a supplier forges a part, a part flies on a program.

No file to read first, no IT, no ticket. The people who live in the domain simply lay down what they already know. The model is their knowledge captured, structured and made explicit, not an interpretation of someone else’s extract.
Not IT, not an LLM: the business writes the model!
Because the point of this step is not to produce a plausible model, but to capture what the business knows. Today, turning the business view into a model usually falls to architects and IT: a long, costly translation that loses meaning on the way, and leaves the business with a model it did not write.
Letting an LLM generate the model does not remove that translation, it automates a guess. The model lands as an external artifact: no one in the room declared it, so no one owns it, and no one can defend it when a something is contested. A declared model survives its first contradiction. A generated one is distrusted the moment it surprises someone.
That does not mean the LLM has no place. It is a strong assistant: it can suggest attributes, flag a relationship no one declared, and draft the mapping from source files onto the model. It helps the business go faster. It does not decide for it.
What the business has just laid down, objects, attributes and relationships, has a name: an ontology. Not in the academic sense, but in the concrete one, a model that states, in the company’s own words, what exists and how things connect. The only difference from what an expert already carries in their head is that here it is explicit, shareable and queryable.
2. Connect the sources
The model is then wired to the real systems: the bill of materials, the certificates, the supplier and customs data. Each source is mapped onto the concepts it feeds. Nothing is copied into a new silo, the graph reads the facts where they already live, which is also what keeps it current when they change.


At this stage, the ontology stops being an empty schema. Populated with real data, it becomes a knowledge graph: the objects turn into thousands of concrete parts, materials and suppliers, linked by the relationships declared in step one. It is this graph, the business model filled with facts, that we question next.
Files first, databases and data lakes next
A CSV or Excel file is the fastest way in. The same step works on live sources: connectors to Snowflake and Databricks are available out of the box, and any database can be connected directly. You write the query that selects the data you need, apply the transformations it requires, and map the result onto the model, exactly as you would a file. Start with an extract to prove the question, then switch to the same mapping in the live source when the use case warrants it.
3. Ask, immediately. And iterate.
With the domain modeled and the sources connected, you ask a question in plain language which returns a result, with no dashboard to develop first. This is the whole value in one line: model the business, connect the sources, and query at once. The angle is no longer built into a view, it lives in the question.

This is where the iterative cycle takes off. Because an initial answer rarely provides the final answer, gaps quickly become clear: an attribute might be missing, or a relationship might point in the wrong direction. Rather than a setback, this is the core value of the model — making missing elements visible so you can refine it further.

With this process, the person asking the question is empowered to refine the model themselves. By adjusting an attribute, remapping a connection, or adding another source, they can re-query the data that very afternoon — avoiding tickets, change requests, or waiting through IT backlogs. Progress takes days instead of quarters.
This flexibility marks a fundamental difference: while an unaligned dashboard requires initiating a whole new project, an unaligned model takes just a quick five-minute adjustment. Rather than simply addressing your starting question, the graph continually adapts to the deeper questions you uncover along the way.
While a single inquiry delivers value on its own, chaining several together offers the complete insight needed to take decisive action. We will demonstrate this multi-step approach in our upcoming article.
Because the first answer is rarely the last word.
An attribute turns out to be missing. A relationship points the wrong way. The answer is correct but raises a sharper question from a different angle. None of this is a setback, it is the model doing its job: the first version exists to make the gaps visible.
Model the domain > Connect the sources > Ask, immediately. And iterate.
This enables a rapid feedback loop, allowing the person who posed the question to implement the resolution directly.. They add the attribute, redraw the relationship, connect a new source, and ask the question again, that same afternoon. No change request, no ticket, no round trip through anyone else’s backlog. Days, not quarters.
This is the difference that matters. A dashboard that misses your angle is a new project. A model that misses your angle is a five-minute edit you made. The graph does not just answer the question you had, it absorbs the questions you discover while asking.
And if one question answers on its own, five questions chained together are enough to decide. That is the demonstration that follows in our next article.
A sneak peek at the results
Once you have modeled the domain and ingested the data sources mapped with the model, you can query your connected data :
- using Graphicient Explore
- via Graphicient AI Chat
- or using off-the-shelf no-code exploration with Neo4j Bloom
(delivered inside Neo4j Enterprise Studio)
Let’s look at the latter, the other query interfaces will be explored in the next articles.
Let’s answer a few business questions on the forged parts problem using graph traversals. Here, the business question is converted into a graph query that connects all necessary data points, sometimes separated by many hops.
Blast radius if a given forger fails

Type SP-2 Blast radius if $forger fails in the search bar, a list of forger names is displayed. Select “Ferland Forge” and Enter, then you’ve got the blast radius if that forger fails, involving the supplied parts and the concerned aircraft programs.
Black box view. Let’s open the white box:

The SP-2 Blast radius… question is a prepared Cypher query:
MATCH path = (s:SUPPLIER {name:$forger})<-[:PART_SUPPLIED_BY]-(p:FORGED_PART)-[:PART_USED_IN]->(:PROGRAM)
WHERE count { (p)-[:PART_SOURCEABLE_FROM]->(:SUPPLIER) } = 1
RETURN path
Let’s develop another example the same way:
Show the full chain for a given part

Here, you just have to select the part number, and all connected information that matters is displayed, with the dependencies between them.
We can observe that this part:
– is used in 1 aircraft program,
– is traced by 2 traceability documents
– is classified under 1 tariff classification
– is made of 1 material melted in the United Kingdom country
– is supplied by 1 supplier located in Germany country
As well, the Bloom search phrase is a prepared, parameterized Cypher query:
MATCH (p:FORGED_PART {part_number:$part_number})
OPTIONAL MATCH a = (p)-[:PART_MADE_OF_MATERIAL]->(:MATERIAL)-[:MATERIAL_MELTED_IN]->(:COUNTRY)
OPTIONAL MATCH b = (p)-[:PART_SUPPLIED_BY]->(:SUPPLIER)-[:SUPPLIER_LOCATED_IN]->(:COUNTRY)
OPTIONAL MATCH c = (p)-[:PART_CLASSIFIED_UNDER]->(:TARIFF_CLASSIFICATION)
OPTIONAL MATCH d = (p)-[:PART_TRACED_BY]->(:TRACEABILITY_DOCUMENT)
OPTIONAL MATCH e = (p)-[:PART_USED_IN]->(:PROGRAM)
RETURN a, b, c, d, e
Neo4j and Graphicient
Neo4j — The world’s leading native graph database
Neo4j Graph Intelligence Platform transforms data into knowledge, powering dynamic, personalized, and autonomous AI systems and intelligent applications so organizations can act faster with confidence.
In manufacturing, Neo4j streamlines supply chains, strengthens traceability, and improves production efficiency by modeling how parts, suppliers, processes and equipment connect:
Supply chain & logistics: mapping suppliers, plants and shipments to spot bottlenecks and optimize routes.
Traceability: linking customer requirements, design and test data to speed root-cause analysis and ensure compliance (e.g. a 5G router traceability platform).
Production planning: critical-path analysis to catch shop-floor inefficiencies.
Caterpillar uses Neo4j for logistics optimization, while Airbus, Lockheed Martin Space, and the U.S. Army rely on it to manage supply chains and product lifecycle data.
Graphicient — The Industrial Knowledge & Compliance Engine
Graphicient is a European, sovereign graph-native platform for industrial knowledge and compliance. With a simple mission: Knowledge to Value.
Large industrial organisations run on fragmented systems. PLM, ERP, MES, quality, and supplier data each hold part of that picture, but none of them holds the whole picture. That fragmentation is also what makes compliance expensive: proving traceability across a product, a supplier chain or a regulatory scope means reassembling evidence by hand, every time. Graphicient connects these sources into a single ontology-driven knowledge graph, so teams can ask a question once and get an answer grounded in the full business context, with lineage to back it up.
Built on Neo4j, the platform combines ontology modelling, graph analytics and LLM-based interaction. That last part matters: an AI agent combined with a graph reduces hallucinations. With a knowledge graph underneath it, they reason from facts and support auditable decisions.
Graphicient is deployed in production at a major automotive manufacturer, with thousands of users and 40+ live use cases covering bill of materials, engineering change, supplier risk and regulatory traceability. We work with industrial leaders in automotive, aerospace, energy and water.
Why Every Forged-Parts Tariff Answer Is Stale by Monday. was originally published in Neo4j Developer Blog on Medium, where people are continuing the conversation by highlighting and responding to this story.
Share Article


Explore
Related Articles


Connected Intelligence: Accelerating Enterprise AI throughout the cloud ecosystem