How to make graphs accessible

Director, Product Management at Neo4j
5 min read
Making graph visualization accessible takes more than keyboard controls and alt text. Here is how Neo4j is approaching a problem that existing accessibility standards were not built to solve.
Graph visualization is, by its nature, a visual medium: nodes, edges, clusters, spatial distance, and related features. These are things you see, and the meaning they convey is inseparable from the act of seeing them. That creates a problem that most accessibility frameworks were never designed to solve.
At Neo4j, we have been working seriously on that problem. Part of that work concerns compliance: the 2024 expansion of ADA Title II explicitly requires web-based software used by US public entities to meet WCAG standards. As the market leader in graph databases and graph visualization, meeting that bar is a baseline obligation. Where possible, we want to do better by engaging with the problem itself rather than focusing solely on the legal obligation.
To be upfront about difficulties, WCAG was never designed to assess the accessibility of a graph visualization. Whilst a graph visualization might exist on a webpage, and thus be subject to WCAG, it is mostly unlike a document.
Accessible graph visualization is uniquely difficult
WCAG 2.2 offers useful tools for most accessibility challenges: color contrast ratios, keyboard navigability, ARIA labeling, text alternatives, and non-click navigation. These work well for documents, forms, and even standard data charts. For example, a bar chart can be described with text, and a table of values can stand in for a line graph. In both cases, the data and the visual representation are separable.
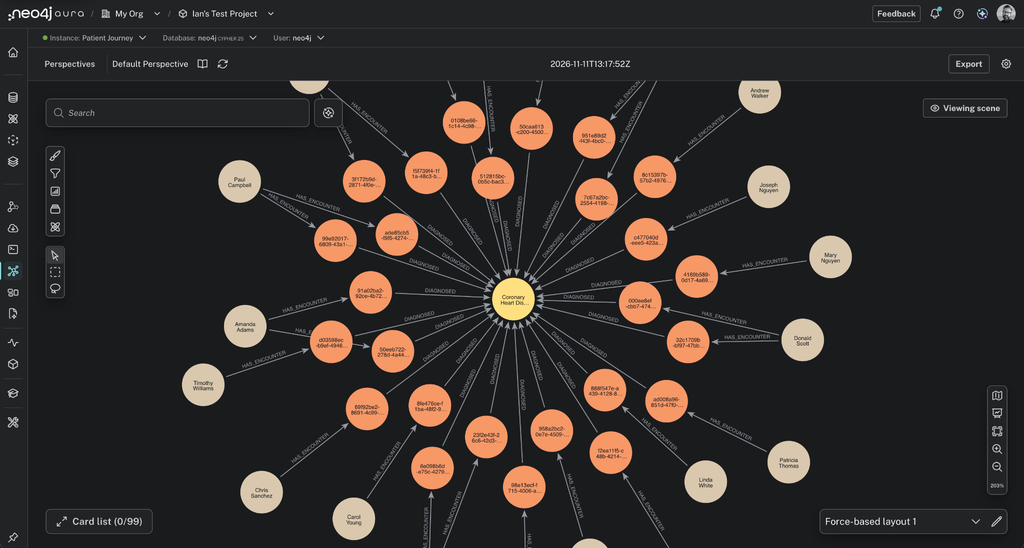
An Aura graph visualization of a patient journey. Its value comes from the relationships, grouping, and overall pattern visible at a glance, which are difficult to fully convey through linear text alone.
Graphs are different. The insight is the topology. When a user looks at a graph visualization and notices a dense cluster of nodes, a bridging node connecting two otherwise separate communities, or the absence of an expected relationship, that gestalt observation cannot be fully reconstructed in a data table or text summary. You can describe the individual components, but the spatial, relational whole resists linearization.
Researchers at MIT have identified that screen readers impose a “linear, predefined order” on content that sighted users experience non-linearly. Consequently, a blind user navigating a chart is beholden to the author’s choices about what information was important to include. The problem is not merely technical, it is epistemic.
Where the research currently stands
The academic community has been building toward solutions for several years, primarily through the CHI and ASSETS conferences. MIT’s work on Rich Screen Reader Experiences for Accessible Data Visualization (Zong et al., 2022) produced the most influential framework to date, proposing three design dimensions for screen-reader accessibility: structure (how entities are organized for traversal), navigation (the operations available to step through that structure), and description (the semantic content and verbosity of what is narrated).
This framework translates reasonably well to property graphs: nodes and relationships have traversable structure, but the theory still struggles to convey spatial clustering and emergent patterns (e.g. path density).
Sonification (the mapping of data properties to audio cues) is an active area of research, but it currently lacks standards for an arbitrary network topology. It works best for time-series data where pitch can follow a natural trajectory. For a graph with heterogeneous node types and relationship properties, no established sonification grammar exists.
As things stand, there are no standardized frameworks for the accessibility of complex interactive graphs. Existing WCAG standards offer only simple approaches, such as data tables and alt text, which diminish rather than replicate the value of the original visualization in this domain.
What we are doing at Neo4j
Rather than treating this effort as merely a box-ticking exercise, we are approaching it in layers. At the compliance layer, that approach entails keyboard-navigable traversal where possible or sensible, accessible colors, and ARIA labeling at the component level.
Where full accessibility cannot yet be achieved, we can choose to hide the canvas by default for screen readers using aria-hidden. We prefer instead to provide metadata descriptions that allow other users to describe what a graph scene contains and what can be learned from it. As large language models (LLMs) improve at interpreting graph data, we are optimistic that reliable descriptions can be generated dynamically for visually impaired users.
This focus on accessibility, which prioritizes consumption, is pragmatic. To meet our accessibility obligations, the graph visualization can be rendered for a screen reader and navigated. However, we recognize that navigating a dense graph with a screen reader is a poor experience. A user could easily become lost or trapped in the canvas while having no clear conception of what the graph explains. Thus, our position on supporting visually impaired graph users is to provide them, by default, with a summary of what the graph contains.
Final thoughts
The users most likely to be underserved by complex data software are also the users least likely to be present when it is built. Accessibility in data tooling has historically been underfunded, under-researched, and deprioritized in product roadmaps. ADA Title II compliance creates a legal floor, which is useful. The more important question is whether someone who relies on a screen reader can derive the same professional value from a graph as a sighted colleague. That is a more difficult problem and a longer road.
Share Article


Explore
Related articles
A workbench for teams to query, explore, and visualize graph data


Introducing Neo4j Virtual Graph: Graph reasoning on the data you already have
Seamless graph intelligence for your Snowflake data estate: The Neo4j and Snowflake partnership