A Walkthrough of Neo4j Virtual Graph on Amazon S3 Tables



12 min read
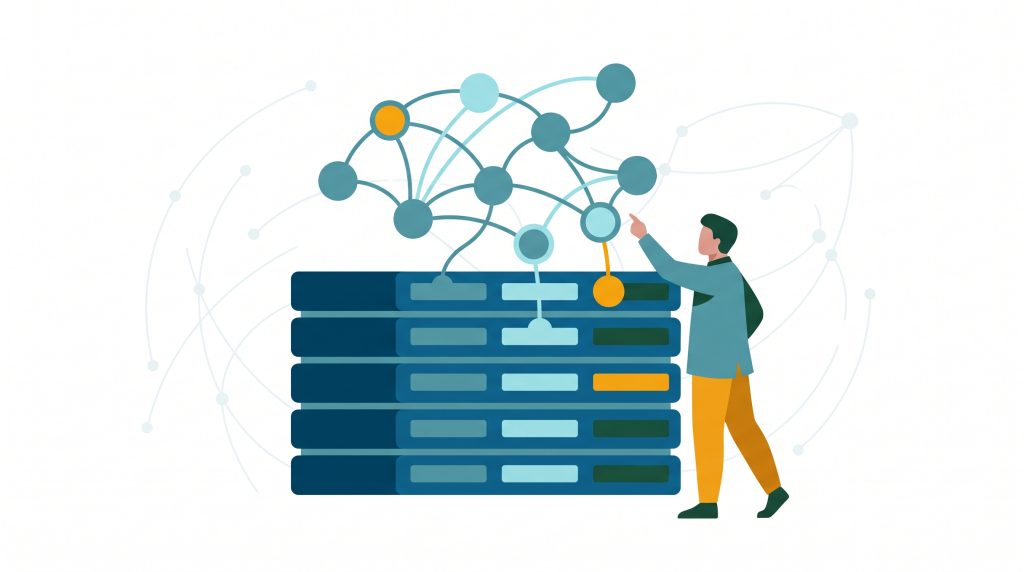
Relational data works a bit like a ledger, where each row records a fact: this account sent that amount on that day, another holds this balance, a third was opened on that date. Ledgers are good at answering what happened. Fraud is harder to see that way, because it shows up in how money moves between accounts, and no single entry records that. SQL can follow those connections with a join for every hop, but the query gets longer with each step.
The usual fix is to copy the data into a graph database. That means a pipeline to build, a second copy to secure and govern, and a graph that is only as current as the last load.
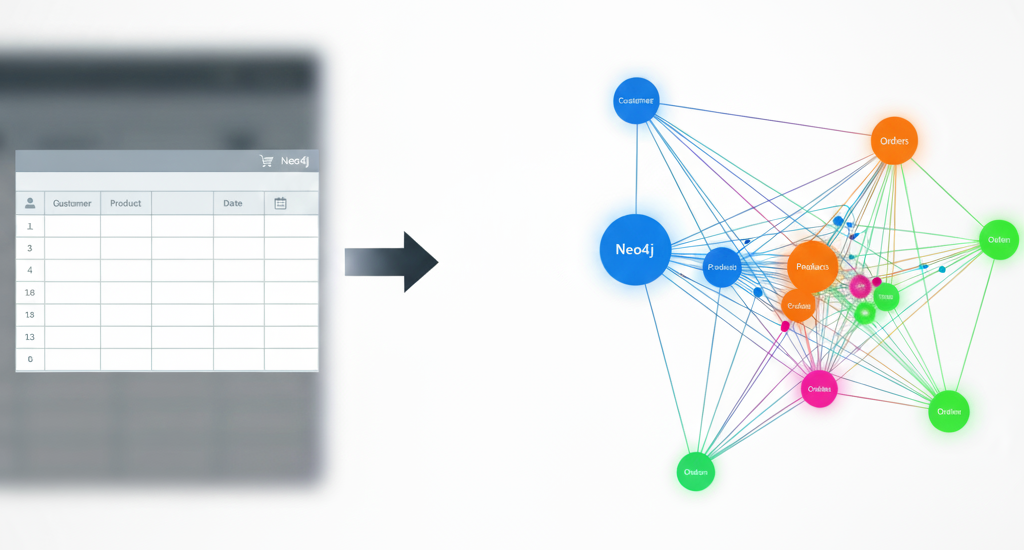
With Neo4j Virtual Graph, you can query your existing tables as a graph, without moving any data. All you need to do is create a graph model over your tables. Then Virtual Graph deterministically translates your Cypher queries against that model into SQL. The query runs against your source tables, and the results land back as a graph.
On AWS, lakehouse data often lives in Amazon S3 Tables, which stores Apache Iceberg tables in an S3 table bucket. Virtual Graph on Aura connects to the table bucket and queries those tables in place. No data ever moves. Only a SQL query goes down, and only results come back.
By the end of this post, you’ll know how to spot fraud patterns, like accounts that sit three transfers from a flagged account, in your own S3 tables. Read on to:
- See how Virtual Graph works on AWS.
- Set up a Virtual Graph over S3 Tables. The demo repository has the full instructions.
- Run a fraud query from the Finance Genie demo on that setup.
- Check the limits and latency to expect before you try it.
Note: This post is based on the demo repository on GitHub. See the repository for more details, including the full setup steps, the graph model and every demo.
Preview: Virtual Graph is generally available on Aura in GCP. AWS support is in preview. Neo4j advises against using sensitive or production data with it during the preview. The Aura console may change during the preview, so some steps in this post may look different from what you see.
Why a virtual graph on S3 Tables
Zero copy removes the work that usually comes with a graph:
- No pipeline: No ETL job copies rows into a graph database, so there is no load to schedule or maintain.
- One copy of the data: The Iceberg tables in S3 remain the single system of record.
- Current results: Every query reads the tables as they are now, so there is no stale graph to refresh.
- Predictable SQL: The Cypher to SQL translation is deterministic rather than generated by an LLM. The same query always produces the same SQL, with predictable performance and cost.
Graph algorithms work on the same data. PageRank, weakly connected components and Louvain run in Aura Graph Analytics sessions over the virtual graph. A session loads the selected nodes and relationships into memory for the length of the analysis.
How it works
Virtual Graph sits between your tables and the applications, agents, notebooks and BI tools that query them. They send Cypher to a Virtual Graph instance on Aura. The instance holds the graph model and translates each query into SQL. Results return as nodes, relationships and paths.
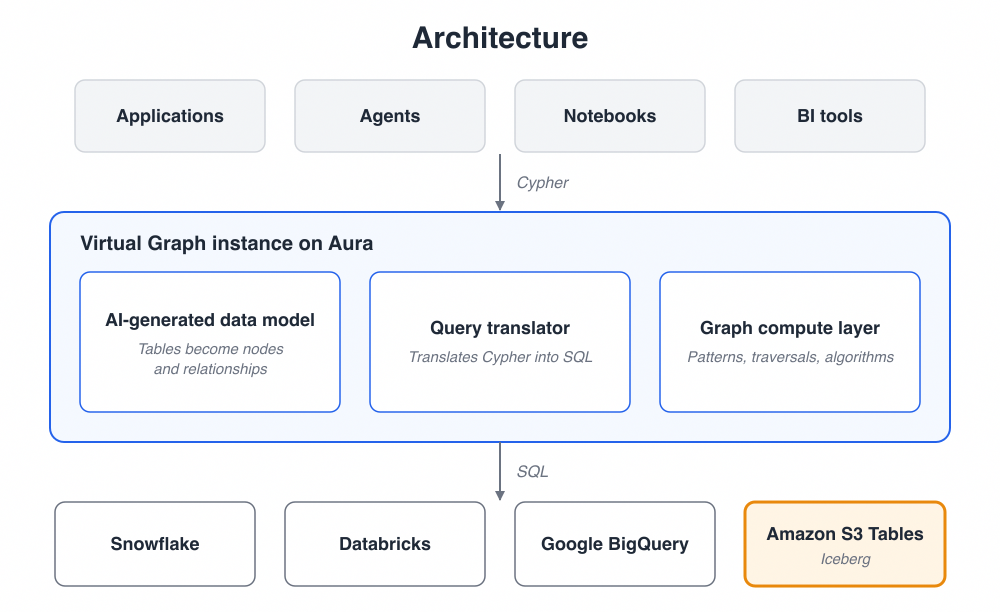
On AWS, the source is an S3 table bucket, and the Aura console is one of the Cypher clients:
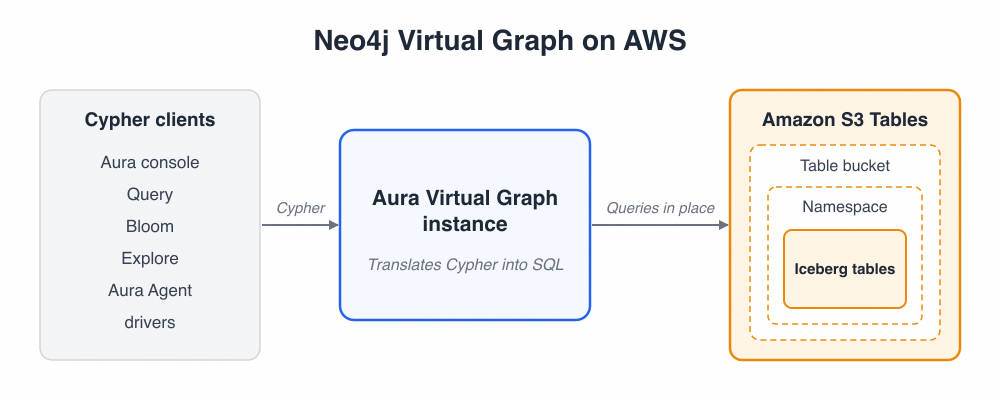
Three AWS pieces define what the graph can see:
- Table bucket: The S3 table bucket is the system of record. It is an S3 bucket type built for Iceberg tables.
- Namespace: A namespace groups tables inside the bucket, like a schema in a database.
- AWS credentials: Virtual Graph reads the bucket with the credentials stored in the Aura data source. The IAM scope of those credentials decides what the graph can see.
Setting it up
The demo connects to the table bucket with temporary AWS credentials. The Aura data source accepts either a long-lived IAM user key or temporary credentials from an IAM role. The setup script uses a role, because some AWS organizations block the creation of IAM users. Credentials from a role are always temporary, so they come with a session token and an expiry time.
Setup takes five steps. The AWS setup guide in the demo repository has the full commands for each one.
- Prepare AWS: You need a table bucket, a namespace, loaded Iceberg tables and a read-only IAM role. A script in the demo repository creates all of them. Credential expiry at the end of this post explains why.
- Create the Virtual Graph: In the Aura console, the user creates a Virtual Graph and chooses AWS as the cloud provider. The region should match the region of the table bucket, to avoid cross-region latency and data transfer charges.
- Connect the data source: The user adds an AWS S3 Tables data source. The form takes a name, the table bucket ARN, the namespace, an AWS key, secret and session token, and the region. The session token is needed here because the demo uses temporary credentials. With a long-lived IAM user key, the session token stays blank. Aura verifies the connection. The Confirm step then lists every table.
- Build the graph model: The model editor offers three starting points: Define manually, Generate from schema, and Generate with AI. The Finance Genie model starts from Generate from schema and is reshaped by hand. The graph model walkthrough lists every edit.
- Start the instance: After the user saves the model, Aura creates and starts the instance.
Example: fraud patterns in Finance Genie
Finance Genie is a synthetic dataset of bank accounts, merchants and the transfers between them. The setup script loads its tables into the finance_genie namespace of a table bucket.
| Table | Rows | Role in the graph |
|---|---|---|
accounts | 25,000 | :Account nodes |
merchants | 7,500 | :Merchant nodes |
transactions | 250,000 | TRANSACTED_WITH relationships |
account_links | 300,000 | TRANSFERRED_TO relationships |
account_labels | 25,000 | Left out of the graph |
The model maps four of the five tables. The account_labels table is left out on purpose. It holds the fraud labels, and keeping it out of the graph preserves it as a way to check results.
What does the Finance Genie graph model look like?
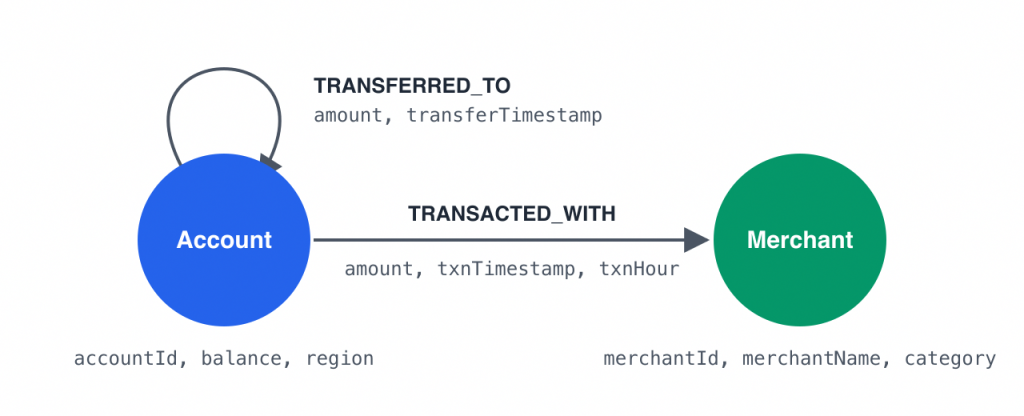
The model has two node types and two relationship types:
:Account: Account nodes come from theaccountstable. The node ID isaccountId.:Merchant: Merchant nodes come from themerchantstable. The node ID ismerchantId.TRANSACTED_WITH: This relationship runs from:Accountto:Merchant. It is built from the transactions table.- TRANSFERRED_TO: This relationship runs from
:Accountto:Account. It is built from theaccount_linkstable.
The same graph model works on other Virtual Graph sources. Only the data source changes.
One question, one pattern
“Which accounts sit three transfers away from a flagged account?” takes a chain of self-joins in SQL. In Cypher it is one path pattern:
MATCH (a:Account {accountId: $flagged})

      -[:TRANSFERRED_TO]->(:Account)

      -[:TRANSFERRED_TO]->(:Account)

      -[:TRANSFERRED_TO]->(c:Account)

RETURN DISTINCT c.accountIdCode language: CSS (css)
The graph has no flag property, because the fraud labels stay out of the model. The caller supplies the account ID as the `$flagged` parameter. It stays a bind parameter in the SQL.
The query maps onto the tables like this:
- Labels:Account maps to the accounts table, and TRANSFERRED_TO maps to account_links.
- Joins: Each hop joins account_links to the previous hop, matching the destination key to the next source key. Only the two named end nodes, a and c, join accounts. The two middle (:Account) nodes have no variable name, so the query never filters on them or returns them. Their IDs already sit in the account_links columns, so they need no join to accounts.
- Filter: The filter on accountId becomes a WHERE clause on the accounts table.
Following money across a range of hops
Fraud rarely sits at a fixed distance. A quantified path pattern follows a relationship a bounded number of times in one pattern, with a condition checked at every hop. This query finds accounts reachable from a flagged account through one to three transfers, following only transfers over 10,000:
MATCH (a:Account {accountId: $flagged})
      ((:Account)-[t:TRANSFERRED_TO WHERE t.amount > 10000]->(:Account)){1,3}
      (b:Account)
RETURN DISTINCT b.accountIdCode language: PHP (php)
Virtual Graph compiles the whole pattern into one recursive SQL query.
Running the Virtual Graph Demos
Run them with the vg-demo command from the demo repository. The demos talk only to the Virtual Graph. The demo guide in the demo repository explains how to connect them and run each one.
uv run vg-demo --demo basic     # exploration and visualization queries

uv run vg-demo                  # fraud demo, the defaultCode language: PHP (php)
The basic demo runs counts, breakdowns and small anchored traversals. Sample output from the basic demo on S3 Tables:
[B3] Accounts by type  (table)

  OK 0.4s, 3 row(s).

  accountType  accounts

  -----------  --------

  business     8384

  checking     8317

  savings      8299

[B11] 2-hop: transfer chain (who does my counterparty pay)  (graph)
  OK 0.8s, 25 path/row(s) returned.
The fraud demo looks for patterns such as structuring, round trips, and fan-in. Sample output from the fraud demo:
[3] Round trips between two accounts (reciprocal transfers)

  OK 1.6s, 50 row(s)

  accountA  accountB  roundTripVolume  legCount

  --------  --------  ---------------  --------

  7855      13727     122721.78        2

  826       14680     63739.41         4

  11613     16005     60963.72         3

[5] Collection accounts (fan-in by distinct senders)

  OK 0.7s, 50 row(s)

  accountId  senders  transfers  inflow

  ---------  -------  ---------  --------

  184        24       24         7322.33

  13589      24       24         13518.09

  19870      24       24         6161.25

[10] Rapid-turnover summary per account

  OK 2.4s, 50 row(s)

  accountId  rapidPairs  avgTurnaroundHours

  ---------  ----------  ------------------

  13914      33229       756.8

  22660      30000       774.9

  15741      29370       771.8Code language: CSS (css)
More Demos in the Sample Repository
The repository has more ways to explore the same five tables, from Cypher examples to graph algorithm demos. Each one connects to the same Virtual Graph as the demos above. The demo guide covers how to run them.
- Graph examples: The graph examples page has Cypher to paste into the Aura Query tab. It covers counts, ego networks, two-hop paths and a few extra console queries.
- Visualization check:
uv run vg-vizfinds a collection account, a spray account and a round-trip pair. It then checks that each anchored visualization query returns a small result. - Fast GDS:
uv run vg-demo --demo fast-gdsprojects a 7-day window of transfers into a Graph Analytics session and runs PageRank. - GDS examples:
uv run vg-demo --demo gds-examplesprojects all transfers once. It then runs PageRank, weakly connected components and Louvain in the same session. - GDS property probe:
uv run vg-demo --demo gds-probeadds numeric properties to the projection. One example is weighted PageRank on the transfer amount. - Ad hoc queries:
uv run vg-probe "<cypher>"runs one Cypher statement and prints its timing.
Two tools in the repository, the 100m demo and vg-generate, run only on the warehouse-based setup. They do not apply to S3 Tables.
What should I know before using Virtual Graph on S3 Tables?
Expect a few trade-offs: queries run slower than on a native graph, some Cypher isn’t supported, and the AWS credentials from the setup script expire.
Virtual Graph is available to AuraDB Professional and Business Critical customers. Instances come in sizes ranging from 4 GB up to 128 GB.
The setup script issues temporary AWS credentials. As an alternative for long lived credentials you can create an IAM user. The script creates a read-only IAM role instead of an IAM user, because some AWS organizations block the creation of IAM users. Credentials from a role are always temporary. Credentials assumed from an SSO session last at most one hour. After they expire, the Virtual Graph loses access until you update the data source with new credentials.
Nothing beats a native graph for Cypher performance.
A native graph stores relationships and follows them directly, while Virtual Graph translates each hop into SQL joins, so queries take longer than on a graph stored in Neo4j. Each query also becomes reads against the table bucket, and S3 Tables bills for storage, requests and automatic table maintenance. The Virtual Graph instance uses Aura Credits while it runs. Not every Cypher feature is supported, including writes to the source data, and the Cypher coverage page lists the current limits.
In the demo repo uv run aws/setup_s3_tables.py --creds-only issues new values without reloading the tables. The new values go in through Import → Data sources → Edit data source in the Aura console. Where an organization allows IAM users, a user with the same read-only policy and a long-lived access key avoids the refresh.
A note on when to use AuraDB. Agents and analysts that think in seconds and minutes are a good fit for Virtual Graph. Applications that need millisecond traversal or continuous writes belong on a native Neo4j database.
Next steps
If you have Iceberg tables and a question about connections, this is a good place to start. Virtual Graph is in public preview, so try it on test data first, and see what your tables have been hiding.
- Demo repository: The demo repository holds the setup script, the IAM policy and every demo.
- Setup guide: The AWS setup guide has the full step-by-step setup, including credential refresh and cleanup.
- Graph model: The graph model walkthrough lists every column, property and mapping in the Finance Genie model.
- Official docs: The Neo4j Virtual Graph documentation covers instances, models and Cypher support.
Share Article


Explore
Related articles
Neo4j Virtual Graph is now generally available

Find impactful graph-powered insights in Databricks