


For more videos from GraphConnect SF and to register for GraphConnect Europe, check out graphconnect.com..
MITRE Corporation is a federally-funded, non-profit company that manages seven national research and development laboratories around the country — including the Center for National Security — to address issues of cybersecurity.
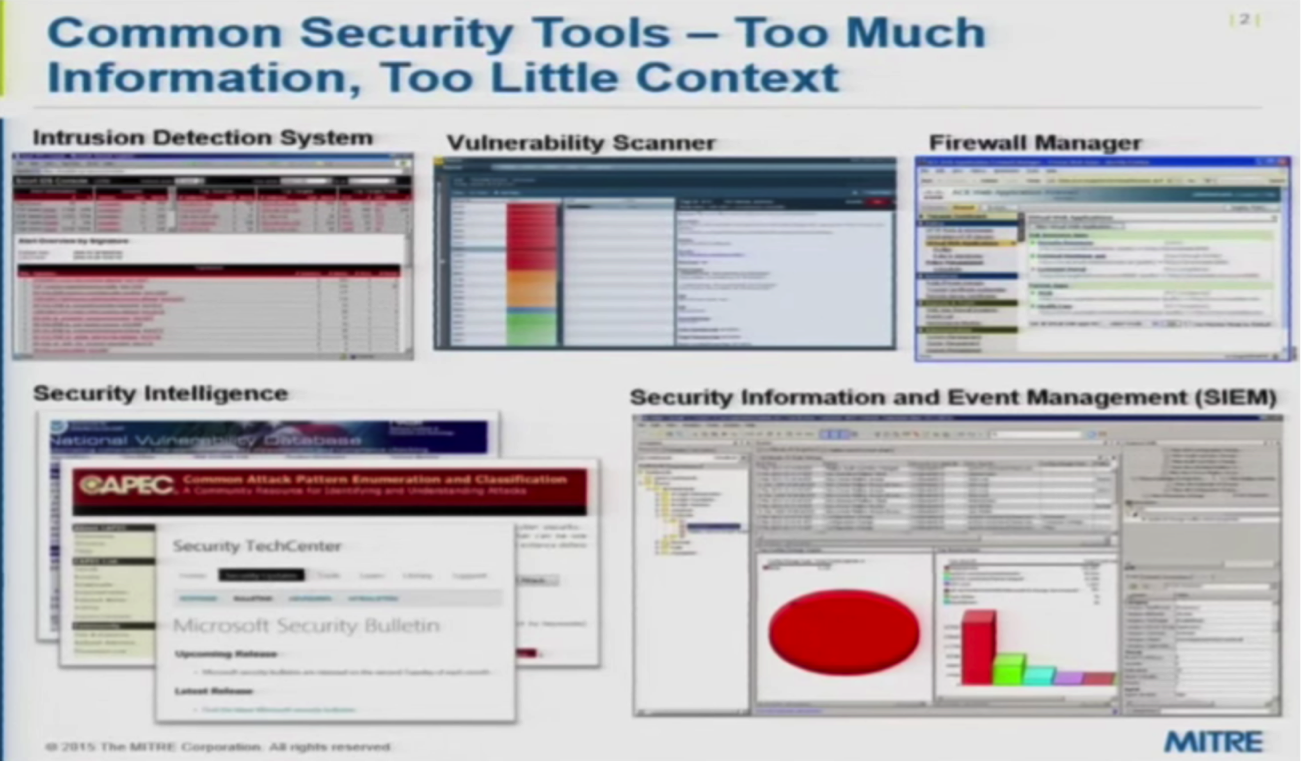
To be successful at cybersecurity, analysts have to keep track of large amounts of detailed information. This includes examining and tracking network and endpoint vulnerabilities, reviewing firewall configurations to ensure vulnerable systems are not exposed and tracking an ongoing deluge of intrusion detection events that necessitate responses.
In order to determine the appropriate response to an alert, a number of questions need to be answered:
- Is the threat legitimate?
- What does it really mean if an alert happens to be true?
- Is it related to a system that needs to be protected?
- Is it a system that ultimately could be used as a stepping stone that leads to a critical service in my enterprise?
The recent data breach from Target was a very methodical campaign with multiple steps that took place over a month. The entry point took place through one of Target’s contractors, which received a security alert at the earliest stage of the attack, but identified it as a false alarm. Had they been able to look at that event in a larger context and examined the potential repercussions of a breach in that area, they may have responded differently.
One of my favorite quotes about cybersecurity is from Steve Ragan of CSO Online: “…information exists without the means to process it in a way that’s meaningful…the little links between incidents, which on the surface look like random, meaningless threats, are often what cause the largest problems.”
In other words, it’s not the individual data points that are important, but how they are related. This suggests a graph model.
Starting Points for Cybersecurity Attack Analysis
Since 2001 — first at George Mason and now at MITRE — we’ve been working to build a way to analyze and pull together all these relevant pieces of information into a graph model.
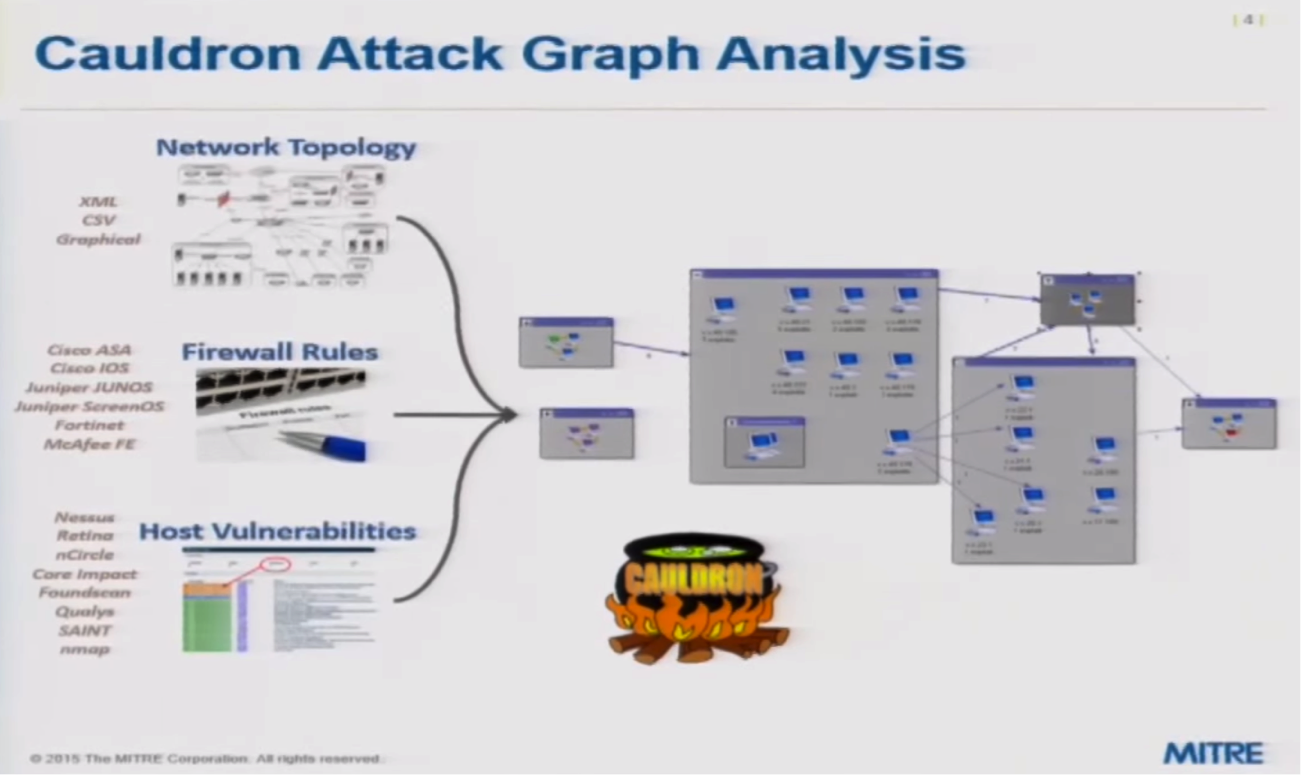
We’ve built a tool called Cauldron to analyze data in a way that prevents cyber attacks. It first takes an expression for how a network is segmented and how those segments fit together and then determines where the firewalls are located and the rules that are applied to each.
Next, it examines the connectivity at a logical level and looks at known vulnerabilities across the endpoints. Finally, it determines all the different ways in which an invasion would get routed through the network, including which firewalls it would pass and the rules applied to each of those firewalls. Each one of those source destinations could be single movement in a potential multiple stepping-stone attack moving through your environment.
Cauldron maps these steps, exposes bottlenecks and shows how an attacker could navigate throughout the environment.
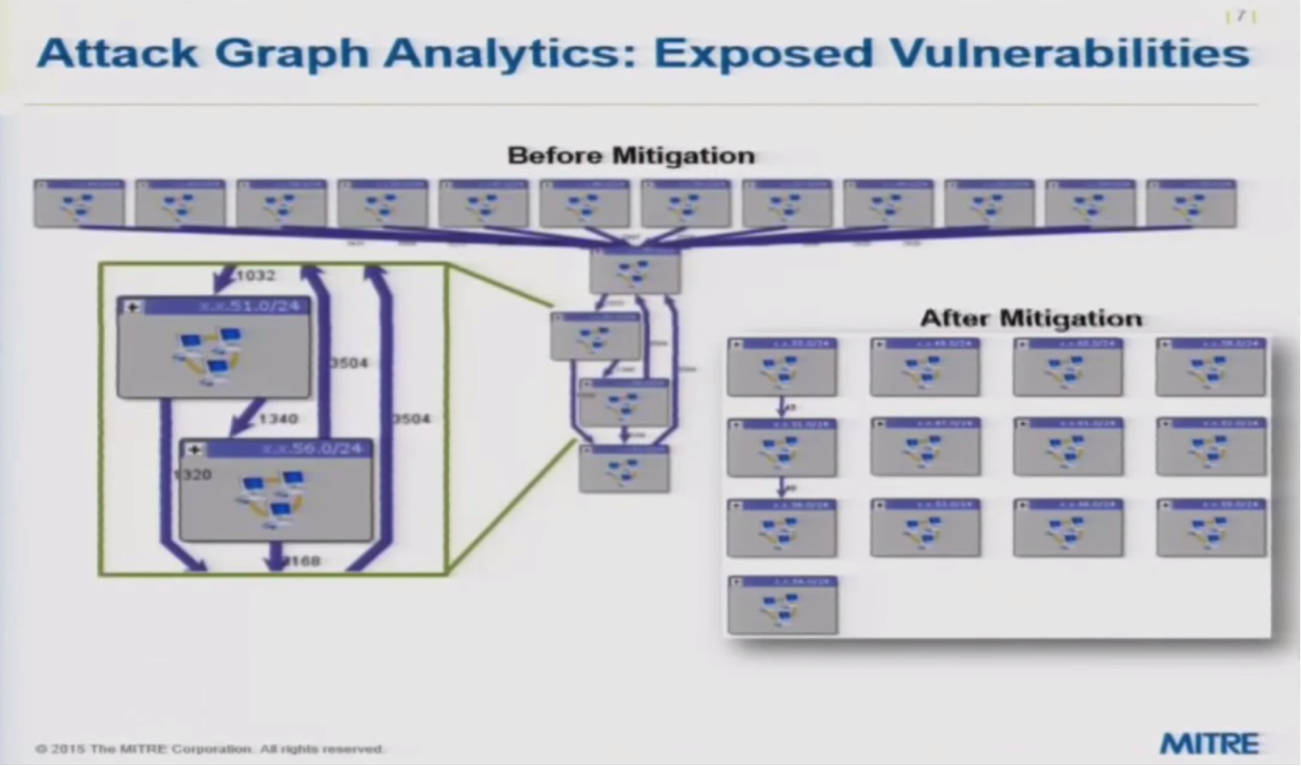
Cauldron also allows you to constrain a graph to points that you think are most vulnerable as well as the information you most want to protect, which is particularly helpful in a large environment:

Another kind of analytic provides a ranked list of exposed vulnerabilities and how frequently they’re exposed, which provides a starting point to begin addressing security issues:
Examining firewall rules to pinpoint vulnerable services — such as sources and destinations — is another great place to start. For example, you could examine the destination of one rule, which could be the source of another rule, and build a graph so that regardless of whether there are actually vulnerabilities on those services at each point, you could postulate that there are zero-day attacks, for example.

Even while we built this custom code, we didn’t have a database — relational or otherwise — as a backend; everything was in XML. As we developed our code, we had some pre-determined notions regarding the type of analytics we were hoping to capture and the queries we were planning to run.
However, as our queries became more extensive, it became clear that they would require custom code, which is expensive. There were a number of things we wanted to run that we simply didn’t have time to code.
CyGraph: Data-Driven Architecture
The following is everything that should be considered when building a cybersecurity system:

Unfortunately, a lot of times the cybersecurity left hand doesn’t know what the right hand is doing. However, in order to be successful, you need to know what’s in your environment, how the environment is configured, how the configuration and setup lends itself to a particular security posture, mapping what you know about your environment and its potential vulnerabilities, etc.
A focus on mission criticality — i.e., what’s important to your mission and understanding what IT or cyber assets support those mission functions — allows you to develop even better cybersecurity systems. Again, the idea is that you need to have an environment, a data model and a way to query and analyze all the information.
We have combined the lessons learned with Cauldron with newer technologies such as Neo4j graph databases to develop CyGraph, a small research project that has been under development for about a year.
Rather than designing a data model by building code to do the analysis, deciding the queries upfront and coding only to that set of requirements, we built a generic data-driven architecture:
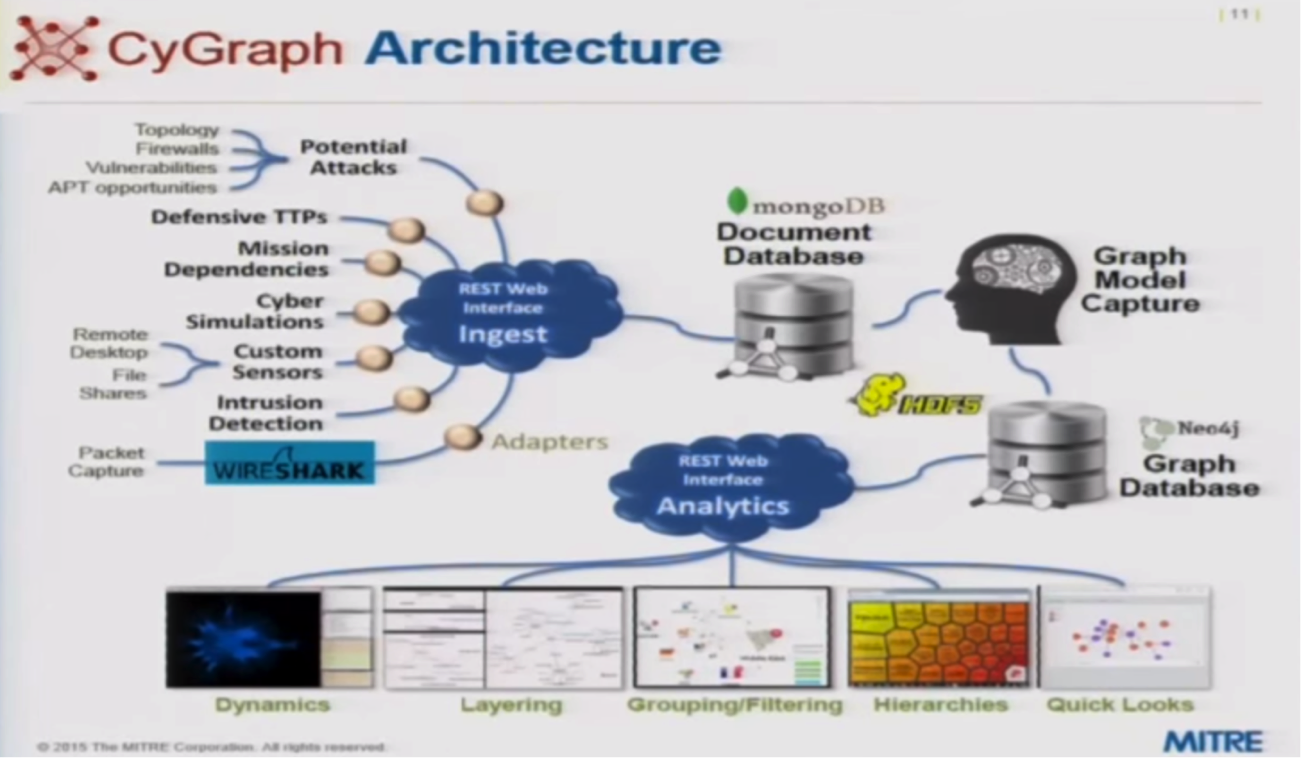
Capturing data in a very generic form and building the analytics based on that generic pattern provides the flexibility to extend the data model, morph the data model and then morph the analytics which, in our case, are graph queries.
But what do you do once you do graph queries? Part of the work is understanding how to capture the problem domain as a graph; what are the nodes, what are the relationships and what are the attributes that need to be captured? How do you formulate the queries that solve important analytic problems?
Narrowing Your Results
We’ve also spent a fair amount of time with graph visualization.
If you know the pattern you’re looking for, you may want to hard-code a query with a few parameters and then execute it. While we support this style, sophisticated analysts are going to need to do things that are outside the scope of the canned queries that have been coded. It’s important to provide the analyst with flexibility so they can perform exploratory ad hoc queries and pull the data they need.
What do you do with the information once it’s been returned by your query? If it’s a simple list relationship, it can be placed in a table. However, if it returns inherently unpredictable graph patterns, visualization becomes an important component of the user experience.
Consider the below “Attack Graph” developed by using the Cauldron tool:
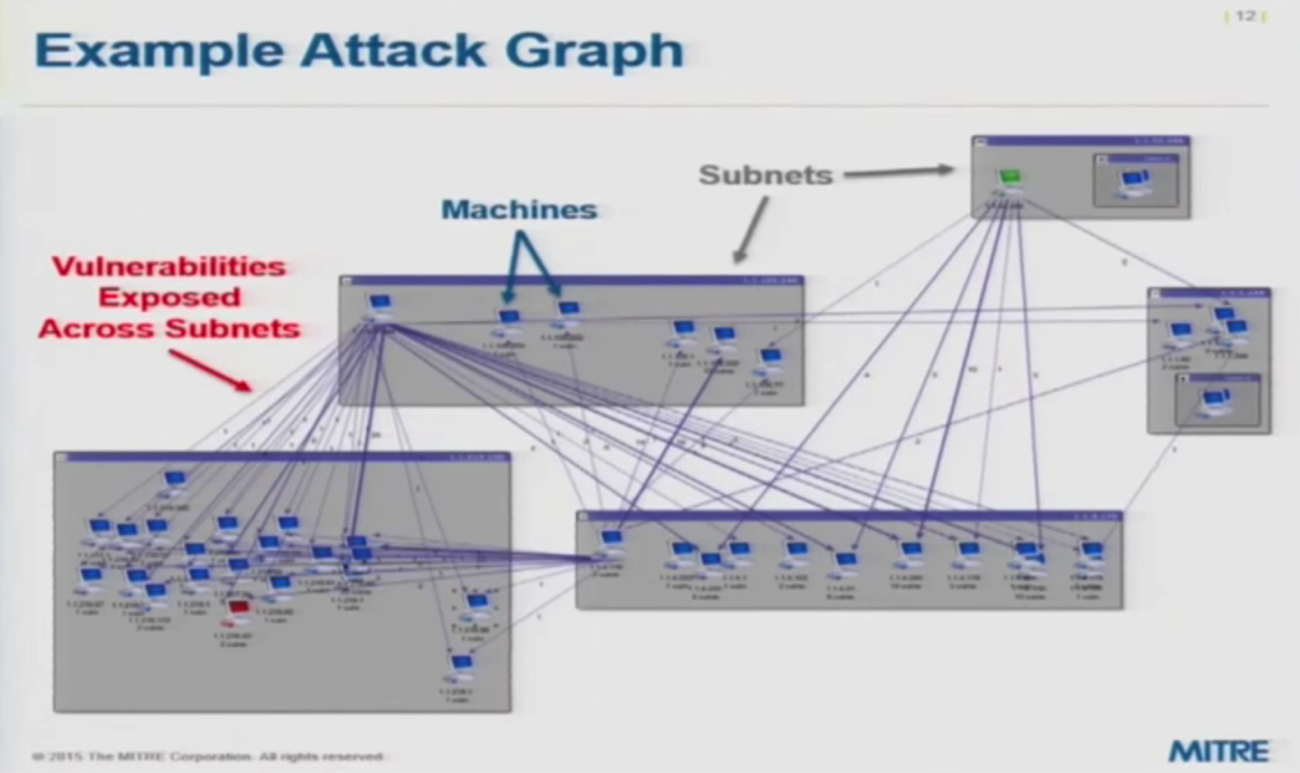
The data model is a set of machines that are in a subnet, and each subnet contains a set of machines. Each machine has one or more vulnerabilities that could potentially be exploited. Machines within each subnet are connected to machines within the other subnets, so machines within a particular subnet can reach the vulnerabilities of computers in other subnets.
This is saying that that particular source machine can connect to a particular destination or victim machine that has a certain set of vulnerabilities. You could then click on one of the edges and get a list about the details for that particular set of vulnerabilities from one machine to another.
The first litmus test is to see if we can capture that data model in a Neo4j property graph. The next is to see if we can get the same result through a Cypher query.
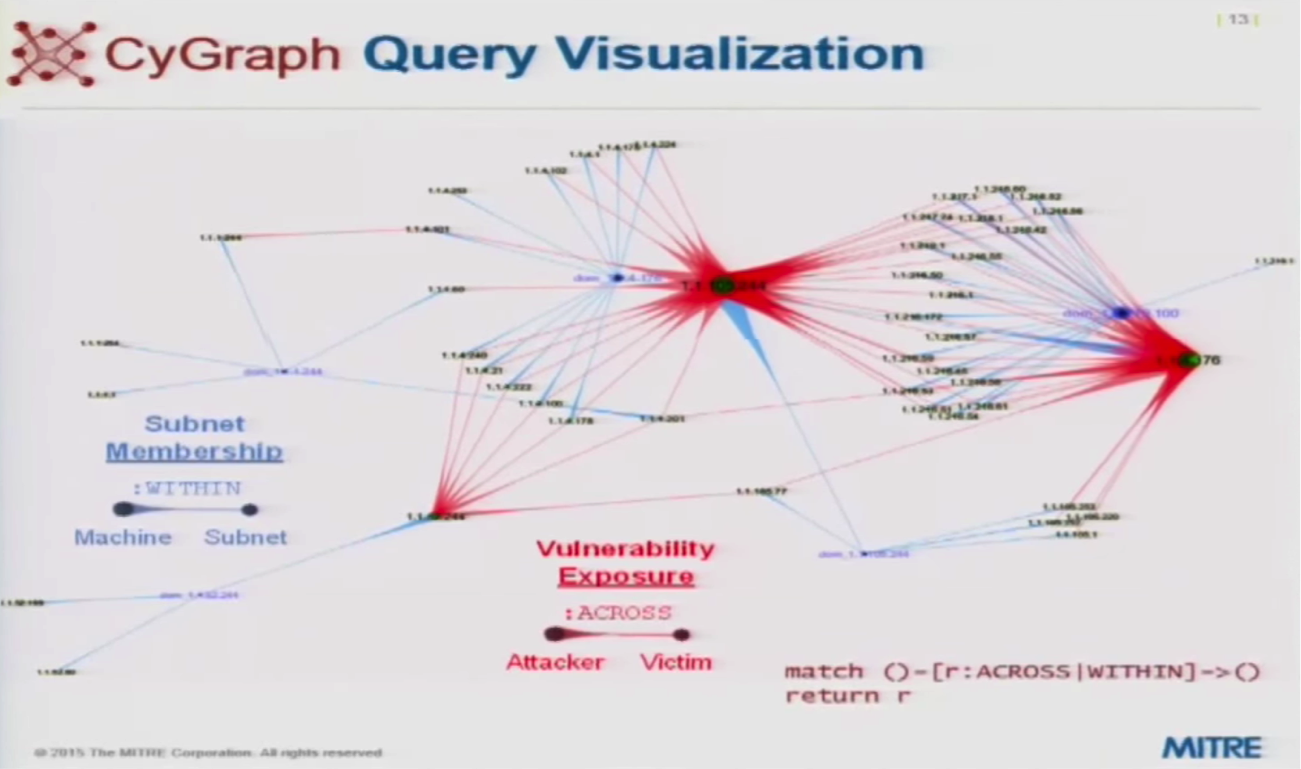
In the above graph, all of the nodes are IP addresses. The blue relationships show the subnet of each machine, and the red relationships are vulnerability exposures extending from an attacker machine to a victim machine across subnet boundaries. The graph effectively shows that there are certain machines that act as bottlenecks and potential sources of attacks.
If you only want to examine vulnerabilities across subnet boundaries, you can restrict the query to only examine those relationships:

Below we’ve extended our domain by adding more things to our stacks, which include those things listed on the left of the slide:

The acronym CVE, common vulnerabilities and exposures, was an effort started by MITRE that was taken over by the National Institutes of Standards and Technology, NIST. CVE is the nomenclature that refers to a standard system for reporting known vulnerabilities about software.
CWE (Common Weakness Enumeration) is a formal list of software weaknesses that can be associated with reported vulnerabilities. CPE platforms are the actual software platforms on which the vulnerabilities are exhibited, and CVSS is a vulnerability scoring system that provides a number that ranks how severe each of the vulnerabilities are.
There are two important takeaways here: One is to be able to explore, understand and feel confident that you can capture the semantics of your environment as a graph, perform queries and get the analytic result that you need. Two, we almost always end up with a large and sprawling graph, which can be reduced in size by applying specific queries that narrow the scope of the search.
Using Graphs to Analyze Multiple Threat Alerts
In the following example, Snort — an intrusion detection system — has sent an intrusion alert. You need to determine how the alert is related to your environment, an answer you’re hoping to determine by running the query included at the top of the graph:

This particular alert includes a certain source (an outside domain) as well as a destination (one of our clients). This alert is detecting a certain kind of attack pattern using a standardized taxonomy called CAPEC, common attack pattern enumeration and classification.
It has detected that this event is a certain kind of attack which we’ve correlated with a known vulnerability. We also know that the attack type works against a known vulnerability that’s associated with the destination machine of that alert. This indicates a legitimate alert that requires a response.
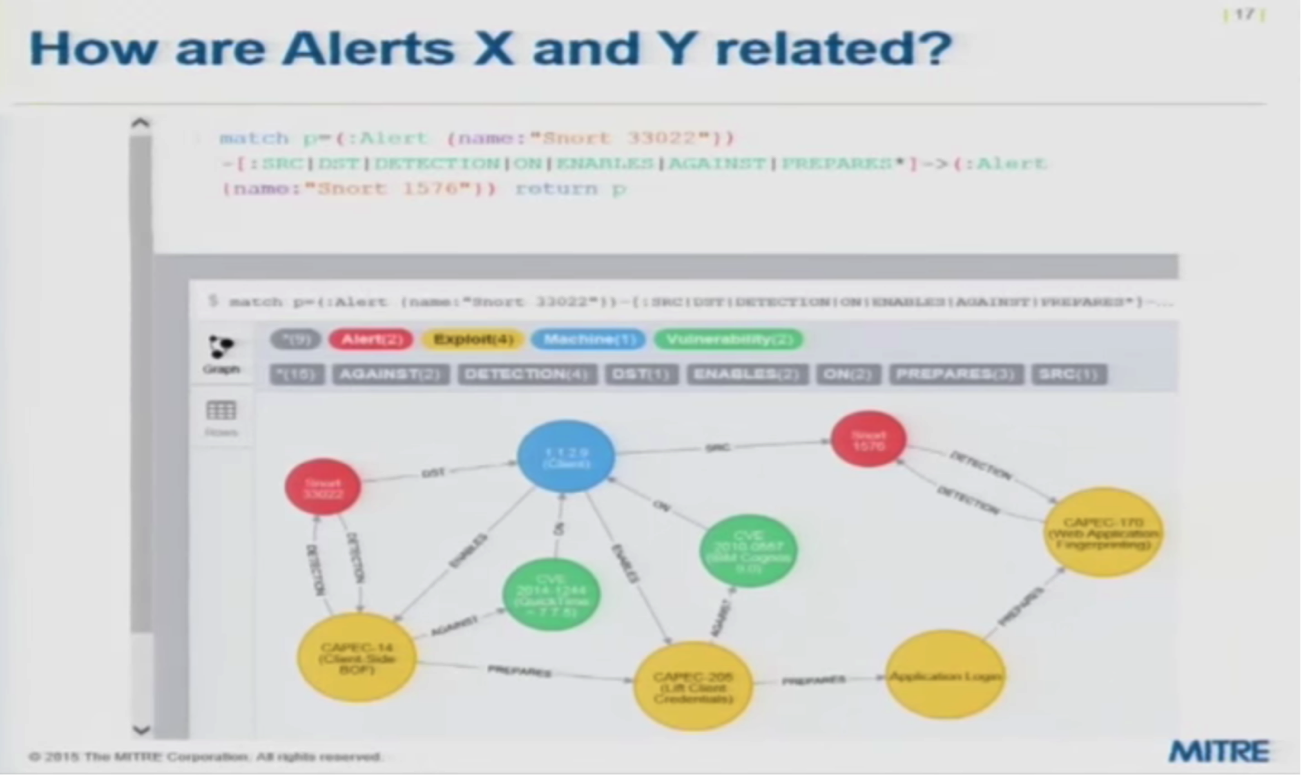
At a later point, you receive a second alert and aren’t sure whether or not to take it seriously. Because you’re receiving a constant stream of alerts, without an investigation you can’t determine whether or not alerts are related or if there’s a larger pattern at play.
This particular query is looking for relationships between Alert X and Alert Y. Based on the below results, we can determine that the two alerts are part of a chain of known stepping-stones, which gives you more evidence that the attack is one that needs to be taken seriously:
You can also take information from recent alerts and – based on your environment – predict other attacks that could be made downstream:
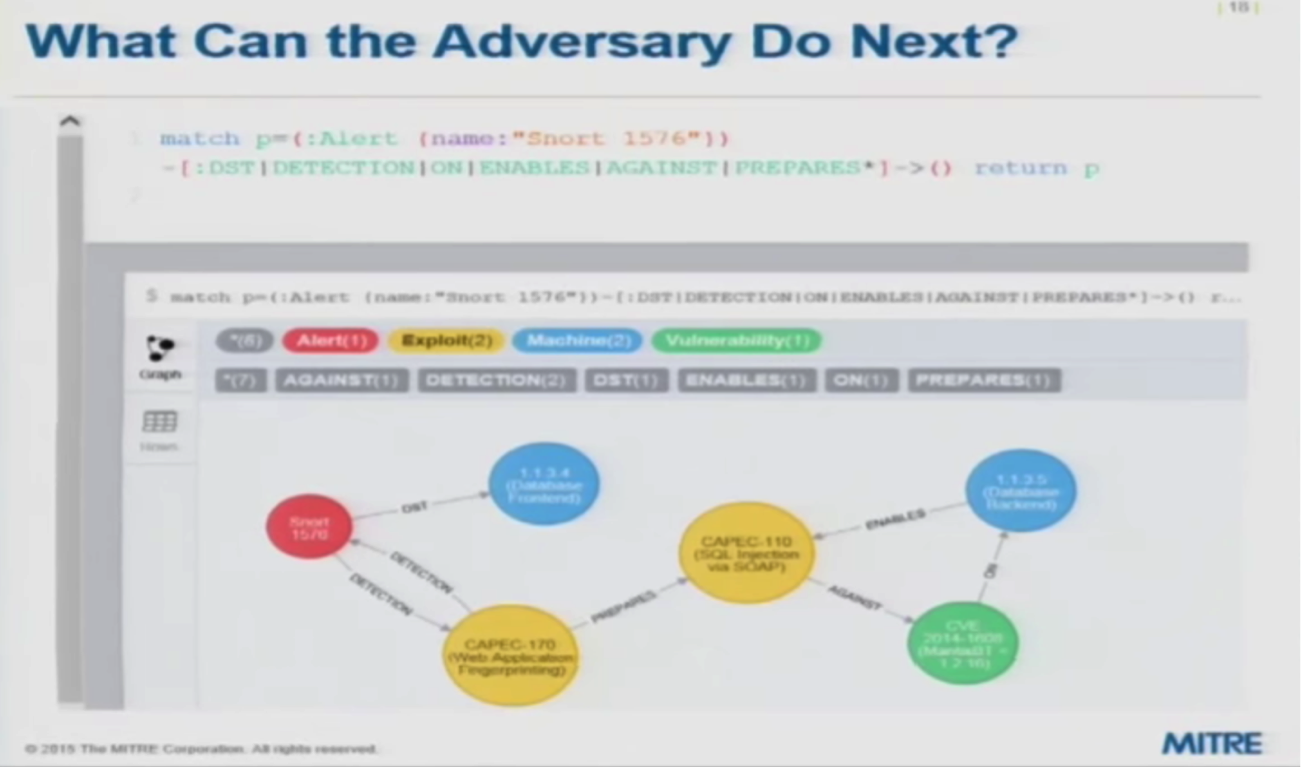
This analysis could show that the attack on this certain database could lead to a mission-critical function, putting your entire mission at risk.
Using Graph Databases to Determine Attack Response
Knowing that this is a serious threat and also understanding the entirety of your environment, how should you respond?
Based on the previous actions of the attackers, you can write a query that will show all of the topological infrastructure paths — such as the routing and through which firewalls traffic passes between those two machines — to point out where to make changes in the environment that will block further access.

Similarly, after the attack has concluded, you may want to do some forensics that will help inform future responses to attacks. A lot of times, intrusion detection systems only pick up some activities, so you may want to review logs in more detail.
Given where the attacker has reached, you can query some of the different paths the attacker could have taken to get to that point and prevent it in the future.

Models and queries have the potential to become extremely complicated. To address this, we’ve developed a domain-specific language for CyGraph that encompasses the scope of our data model, the examination of that model, queries and subqueries.

ANTLR is a framework for automating. In ANTLR, you define your language, which in this case is domain-specific.
It has the ability to understand any instance or string that’s supposed to fit into that particular input grammar. Then for each element of that parsed tree we have code that can convert it into Cypher. So we have a language written specifically for a Cypher domain with all the knowledge about how your model is expressed or represented, which simplifies and provides that layer of abstraction.
CyGraph Applications
Below is a screenshot of an actual customer dependency graph that was built over a period of years. Each person in the organization was tasked with capturing the information and network assets they depended on to perform both standard and mission-critical roles.

We’ve also looked quite a bit at packet capture data — for example, trying to detect malicious activity within a network. One of the challenges we faced was that the large graphs can become too cluttered.
When walking through a play-by-play of attacks, you frequently need to focus on a particular moment. As part of the user interface visualization, we added this behavior where it highlights the most recent with that sliding window.

Another use case is modeling and simulation.
We went through a project where we applied CyGraph and captured a process model, which is a process flow that includes all the timing and relationships regarding how a process gets completed. We captured not only the mission processes but also the cyber attackers, the cyber defenders and all the corresponding required resources. CyGraph becomes a window in the simulation.

Another application I mentioned is CAPEC, a taxonomy for common attack pattern enumeration and classification. It’s very laborious to navigate through the CAPEC site and difficult to understand the big picture about large categories of different types of attacks and the more refined kinds of attacks within those larger groups.
We built the below navigation system for CAPEC taxonomy to address these issues:

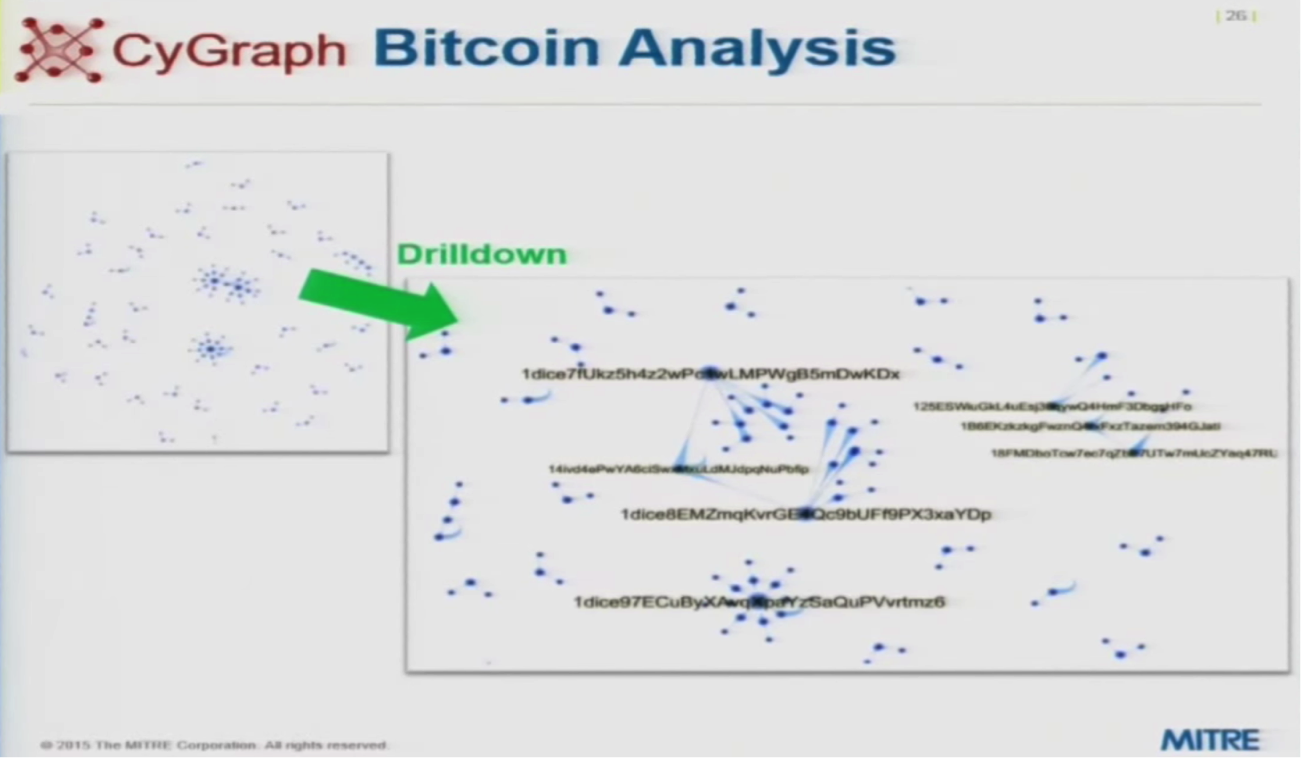
We’ve also done a lot of work relating to Bitcoin transactions, which has a lot of issues related to cyber attacks:
In summary, the best way to build a cybersecurity tool is to build generic property graphs for flexible representation.
Graph queries make it possible to focus your analysis on the relevant portions of the graphs, allowing you to pinpoint vulnerabilities and target responses. Use of a domain-specific query language allows you to simplify queries and relying on data-driven architecture to inform your model provides added flexibility.
Inspired by Steven’s talk? Register for GraphConnect Europe on April 26, 2016 at for more industry-leading presentations and workshops on the evolving world of graph database technology.


