Build Custom Graph Visualizations with Neo4j NVL

Lead Software Engineer
4 min read
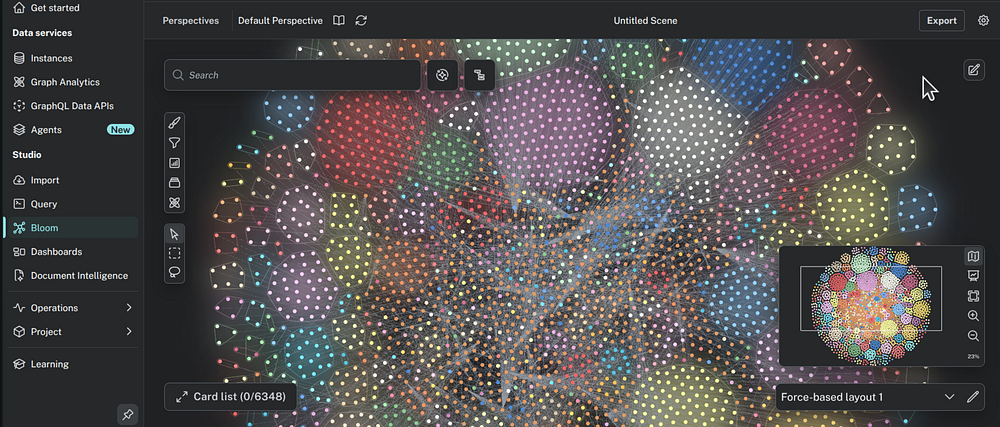
Graph visualization shouldn’t force every application into the same interaction model. The Neo4j Graph Visualization Library (NVL) provides developers with a flexible foundation for building custom graph experiences tailored to their users and workflows.
NVL gives developers the building blocks to create custom, interactive graph experiences within their own applications. Rather than prescribing how users should interact with a graph, it leaves those decisions to the developer. Every interaction can be built around the needs of the application.
Why NVL takes a flexible approach
Graph visualizations have been part of Neo4j from the beginning. Whether for visualizing query results, interactively traversing a graph, drawing a graph schema, or displaying database clusters, we have implemented several different solutions for displaying and interacting with graphs. As graph visualization appeared across more Neo4j products, developers needed a familiar experience from one tool to the next, without every product losing the flexibility to support its own workflow.
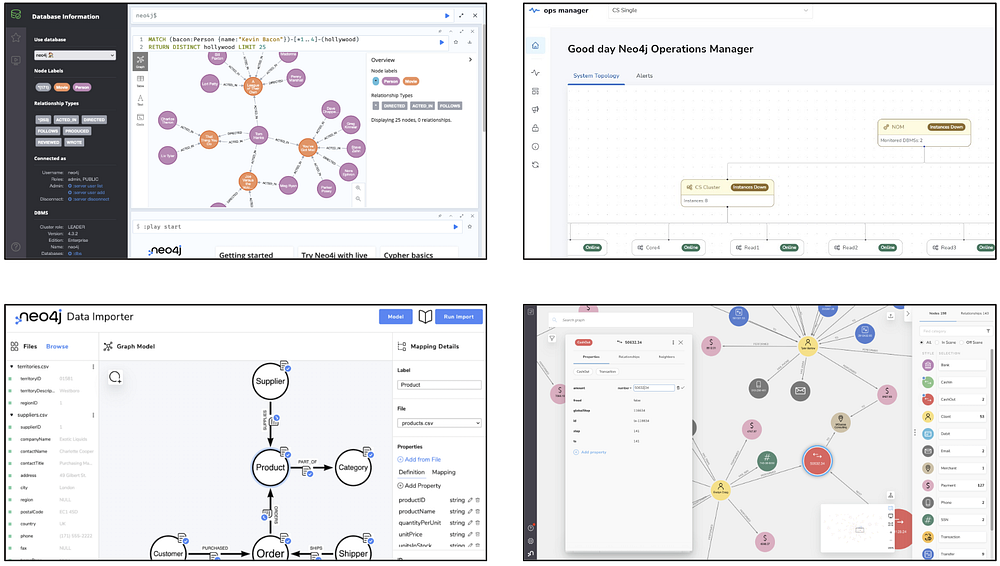
Graph visualization across Neo4j products in 2022, before NVL brought these experiences onto a shared foundation.
In 2023, we decided it was time to bring them together through NVL. The main anchoring principle was to remain unopinionated in interactions. Each of our applications had its own unique needs. And who could anticipate what requirements future apps might have? Classic graph interactions like panning with a drag or zooming with the mouse wheel could not just be assumed and hard-coded into the library. Making different types of interactions configurable seemed likely to yield an extensive set of options that would never fully fit all use cases.
Choose the right NVL package
In the end, we decided to completely strip interaction from the library. We called it the base library, published on npm under @neo4j-nvl/base. For a completely customized graph viz application, this is the place to start. To implement custom interactions, NVL provides a .getHits method. This method takes any pointer event on the visualization canvas and enriches it with information about what was under the pointer (nodes, relationships, clusters, etc).
With that, the parent application can update its UI and NVL’s state (zoom, pan, positions, etc.). This allows users to create completely unique and customized interaction behaviors based on their application’s requirements, such as graph traversal UI in Bloom or custom graph drawing capabilities in Importer’s data modeling tool. You can find a code example demonstrating the .getHits method on our examples page here.
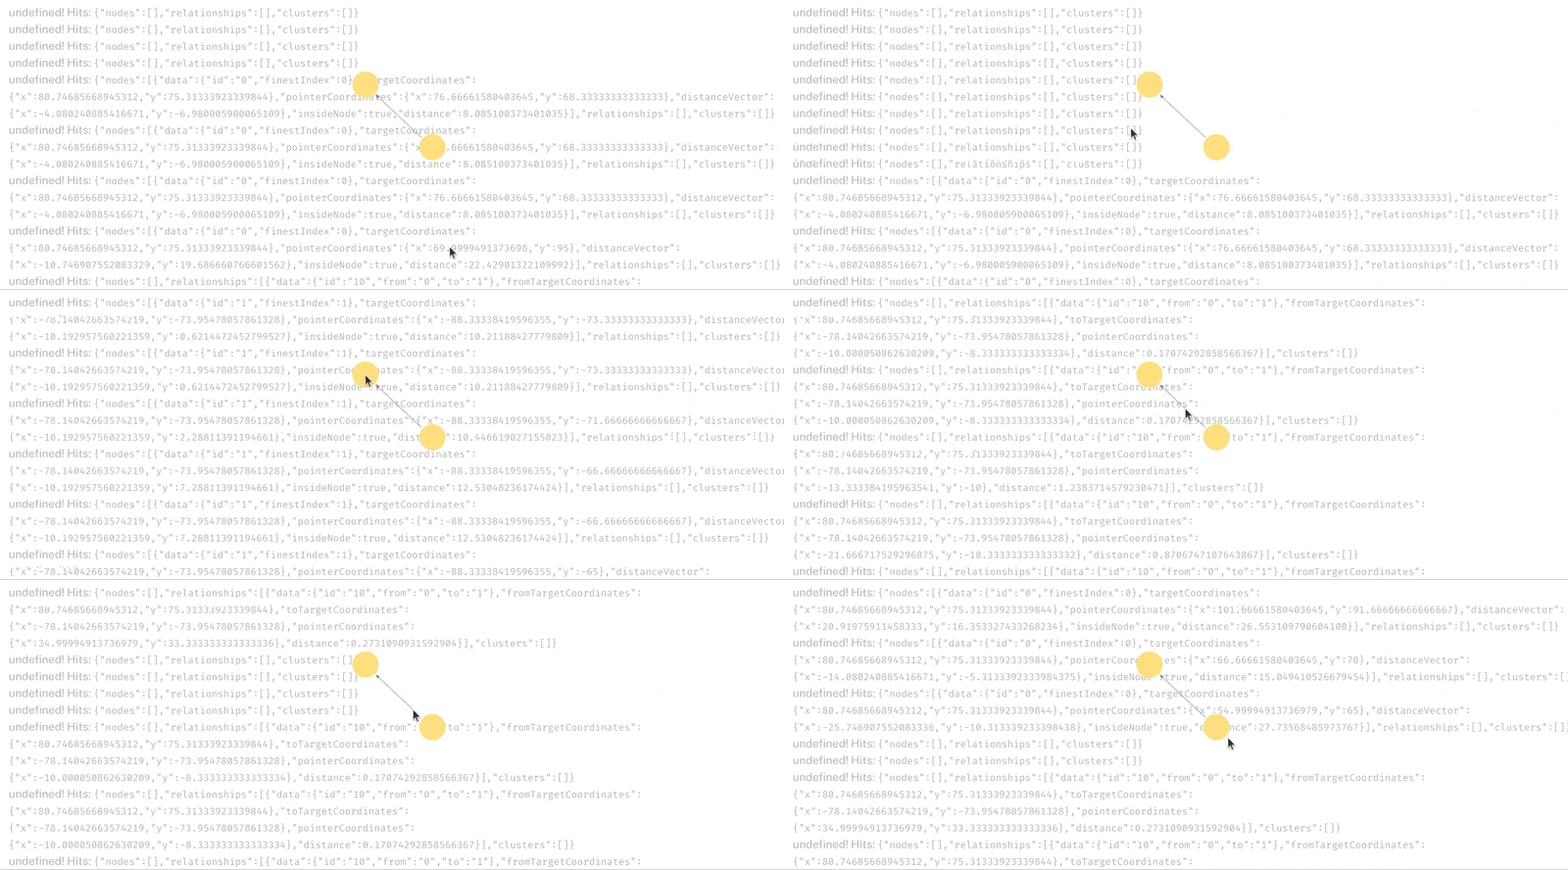
NVL’s .getHits method enriches mouse events with information about the graph elements under the pointer.
To still be able to get classic graph interactions working quickly, we published the @neo4j-nvl/interaction-handlers package, a set of classic graph interactions that can be added to NVL and reused across implementations. You can find a code example demonstrating this on our examples page here.
If you use React, we also created a common set of React components wrapping NVL, which we published under @neo4j-nvl/react.
Finally, if you want an accommodating UI, such as tooltips and legends, we created a special component in our Design System. This component is a ready-to-use graph visualization component that can easily be used with Neo4j data.
We presented our new library and its conceptualization at the NODES 2023 conference:
NVL across Neo4j products
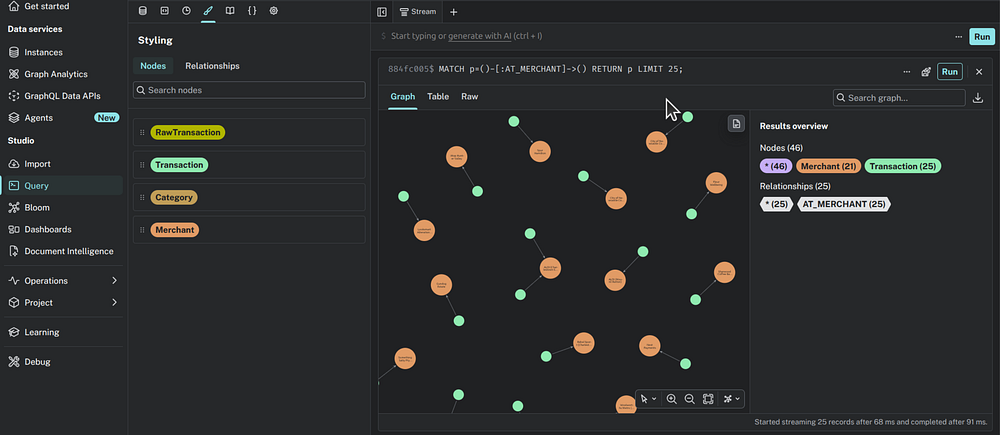
NVL inside Neo4j Query
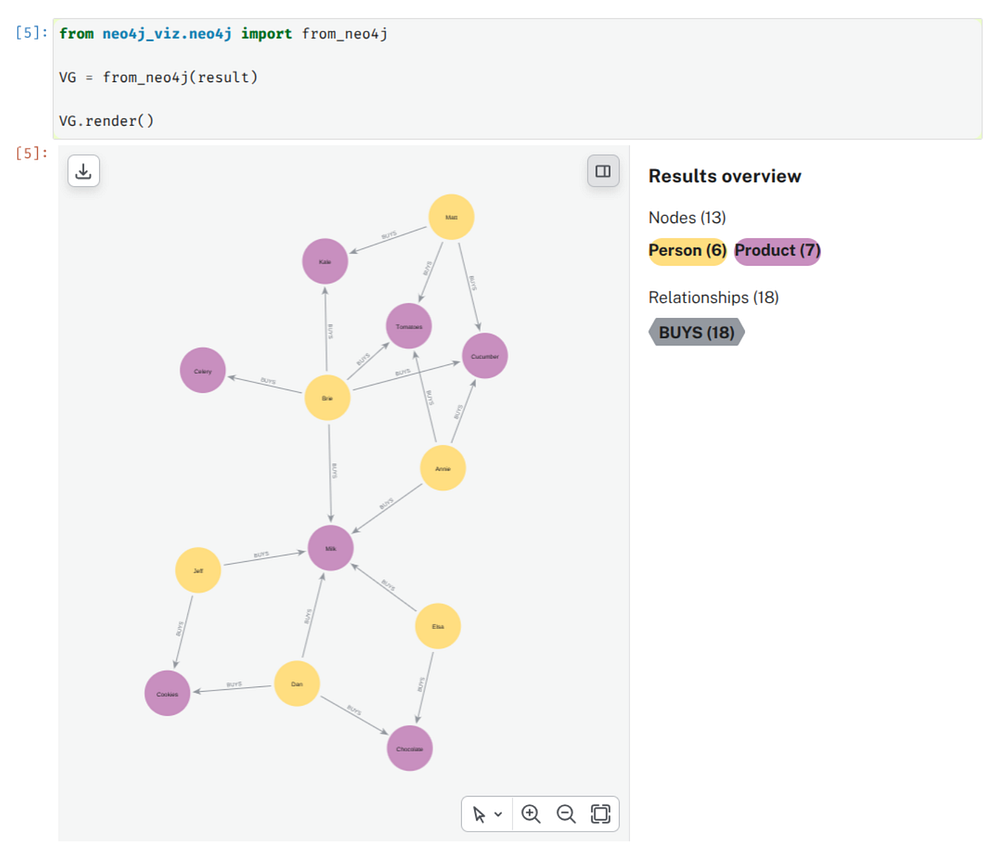
NVL inside Neo4j Python Graph Visualization
Neo4j’s Importer and Bloom also use NVL for the underlying graph drawing engine.
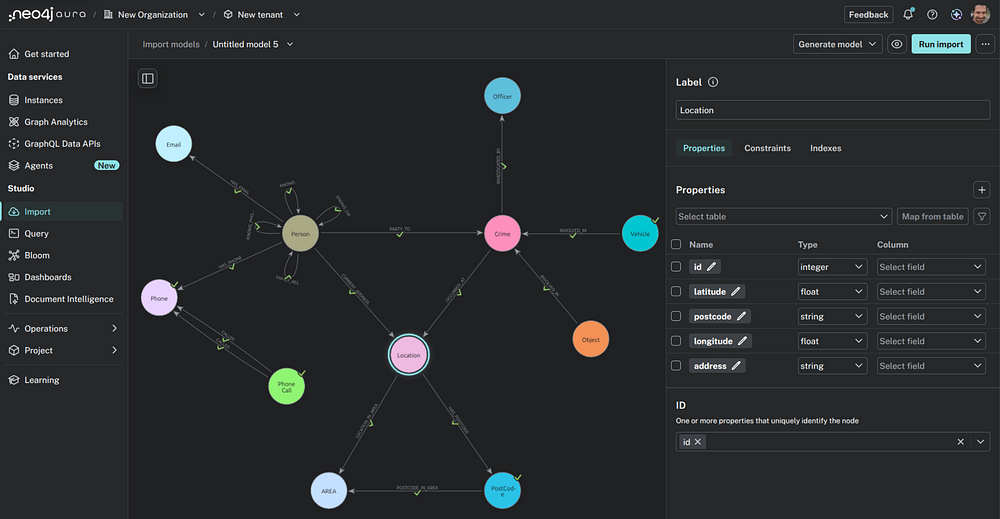
NVL inside Neo4j Import Models
NVL inside Neo4j Bloom
Get started with NVL
NVL is free to use with a Neo4j license. You can download Neo4j Desktop or set up an Aura instance and start visualizing your graph right away. You can find several boilerplates to help you get started at https://github.com/neo4j-devtools/nvl-boilerplates. API documentation is available at https://neo4j.com/docs/api/nvl/current/, along with several examples.
If you get stuck or have any feedback, drop us a message on our community forum or our Discord server.
Looking for inspiration? See what developers are building with NVL.
Share Article


Explore
Related articles