
Find Connected Insights with Graph Intelligence for Microsoft Fabric
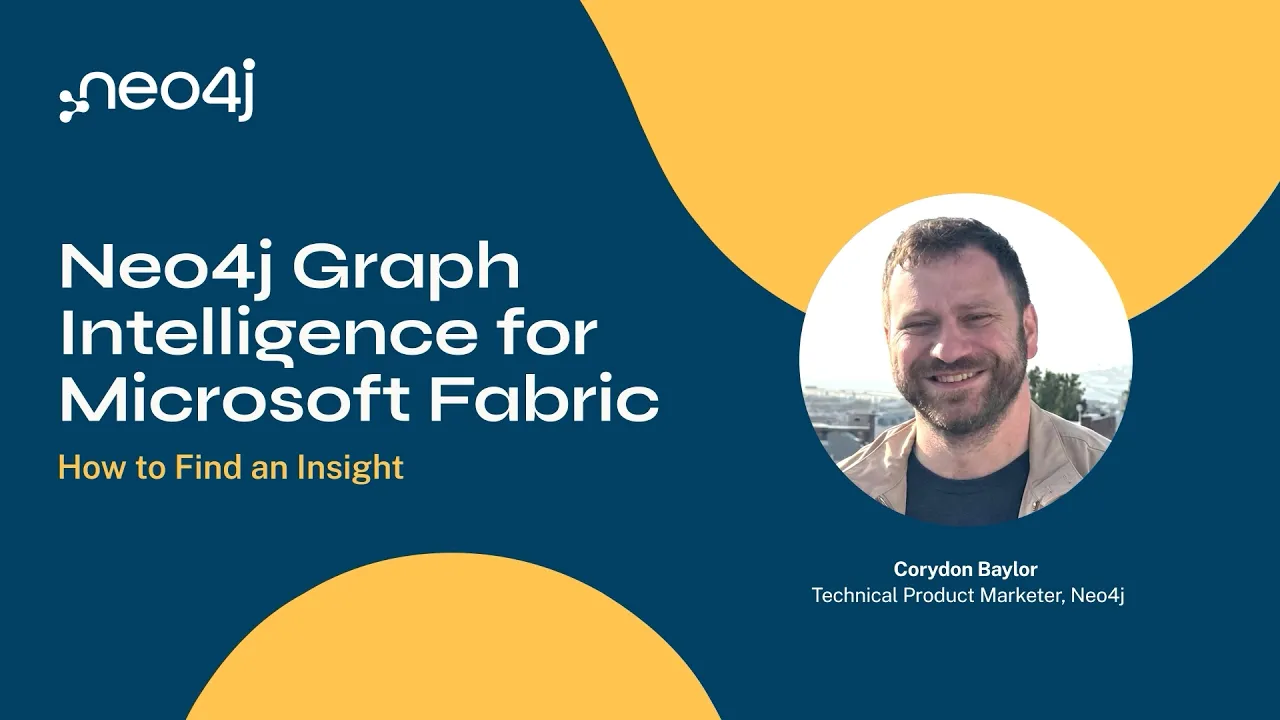


The video discusses how to explore a graph in Neo4j Graph Intelligence. Corydon uses the New York City subway system as the graph, which includes stations connected to other stations.
You will learn how to
- Visualize your graph in a coordinate layout using latitude and longitude data
- Apply graph algorithms — including betweenness centrality
- Write Cypher queries directly in the visual interface
- Find the shortest path between two nodes interactively
Resources mentioned
Cloud & data platformsVisualization
- Watched Duration: 2:22

- Watched Duration: 7:35

- Watched Duration: 6:55

- Watched Duration: 48:59

- Watched Duration: 3:32

- Watched Duration: 27:21

- Watched Duration: 34:31

- Watched Duration: 29:59
