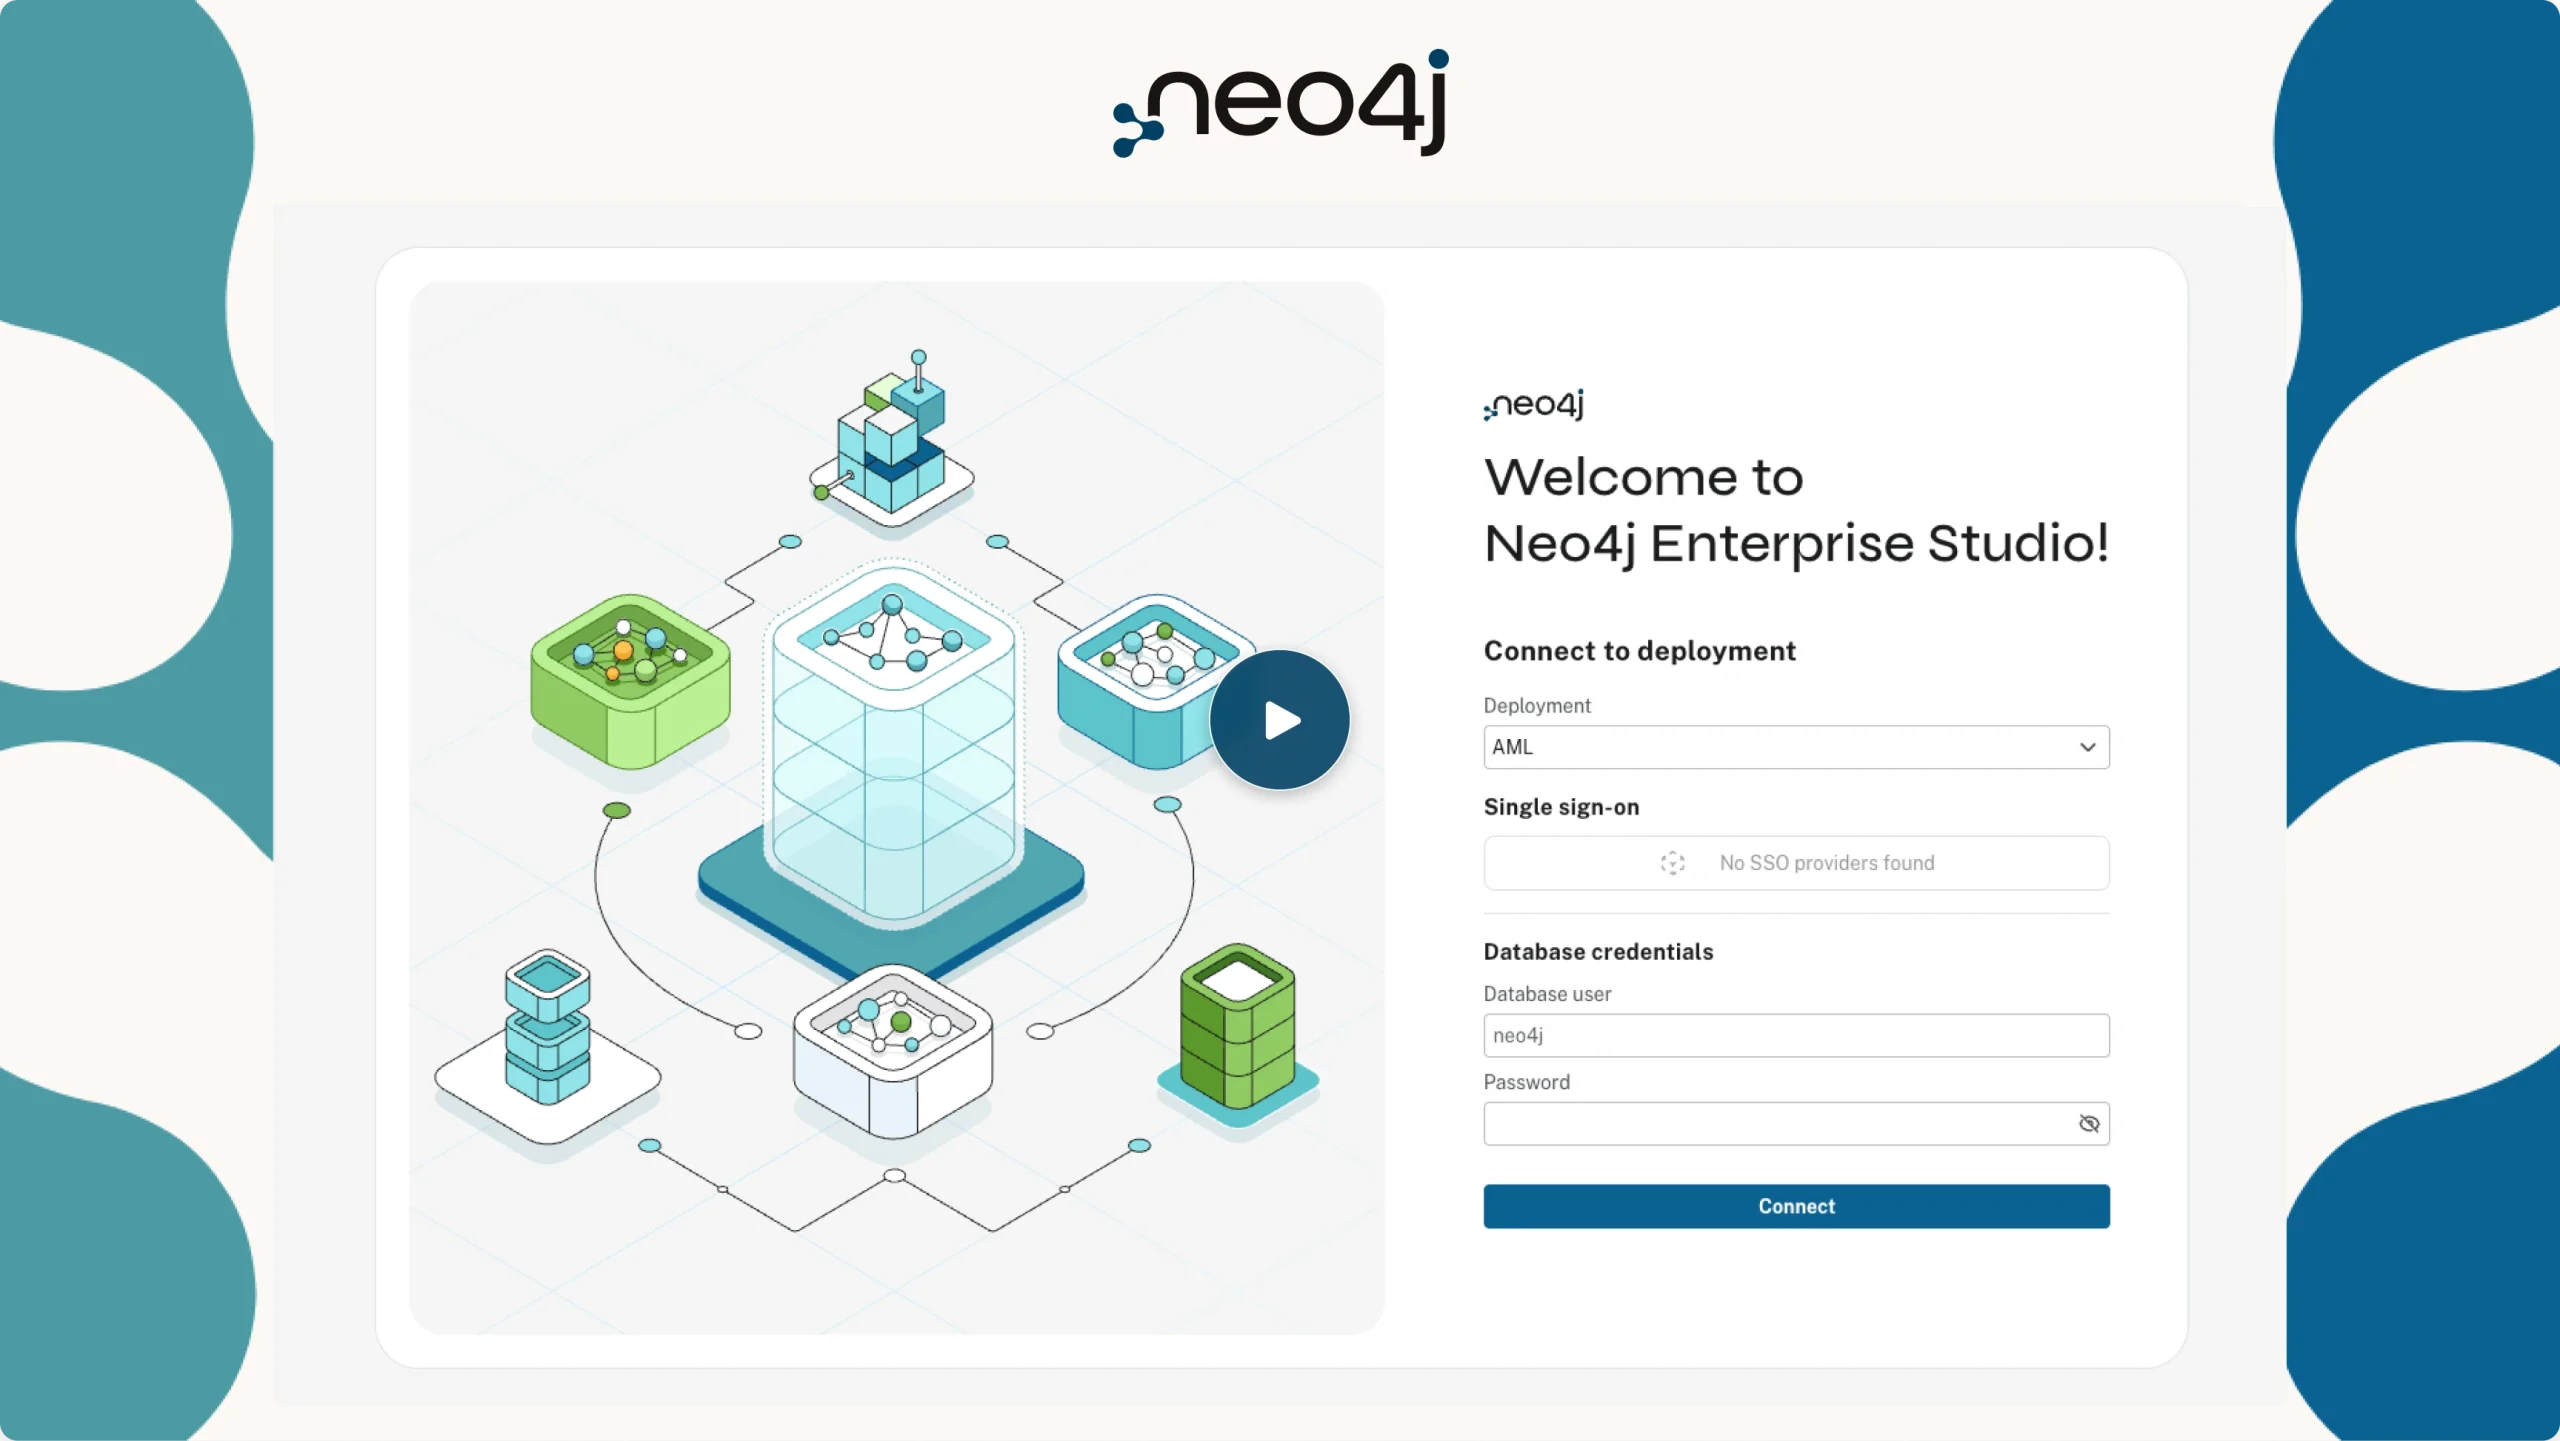
Neo4j Enterprise Studio
Collaborative graph tools to understand your data
Collaborate with your teams to securely explore connected data, uncover insights, and create shared dashboards.

Gain insights from connected data
Find patterns, bring insights to the surface, and make informed decisions
Share team expertise
Share queries, saved views, and dashboards
Keep data secure
Prevent data from traversing public networks and authenticate with single sign-on
Demo
Your workbench for connected data
See how Neo4j Enterprise Studio empowers teams to work together to uncover and share insights.
Capabilities
Collaborate to uncover insights with Neo4j Enterprise Studio
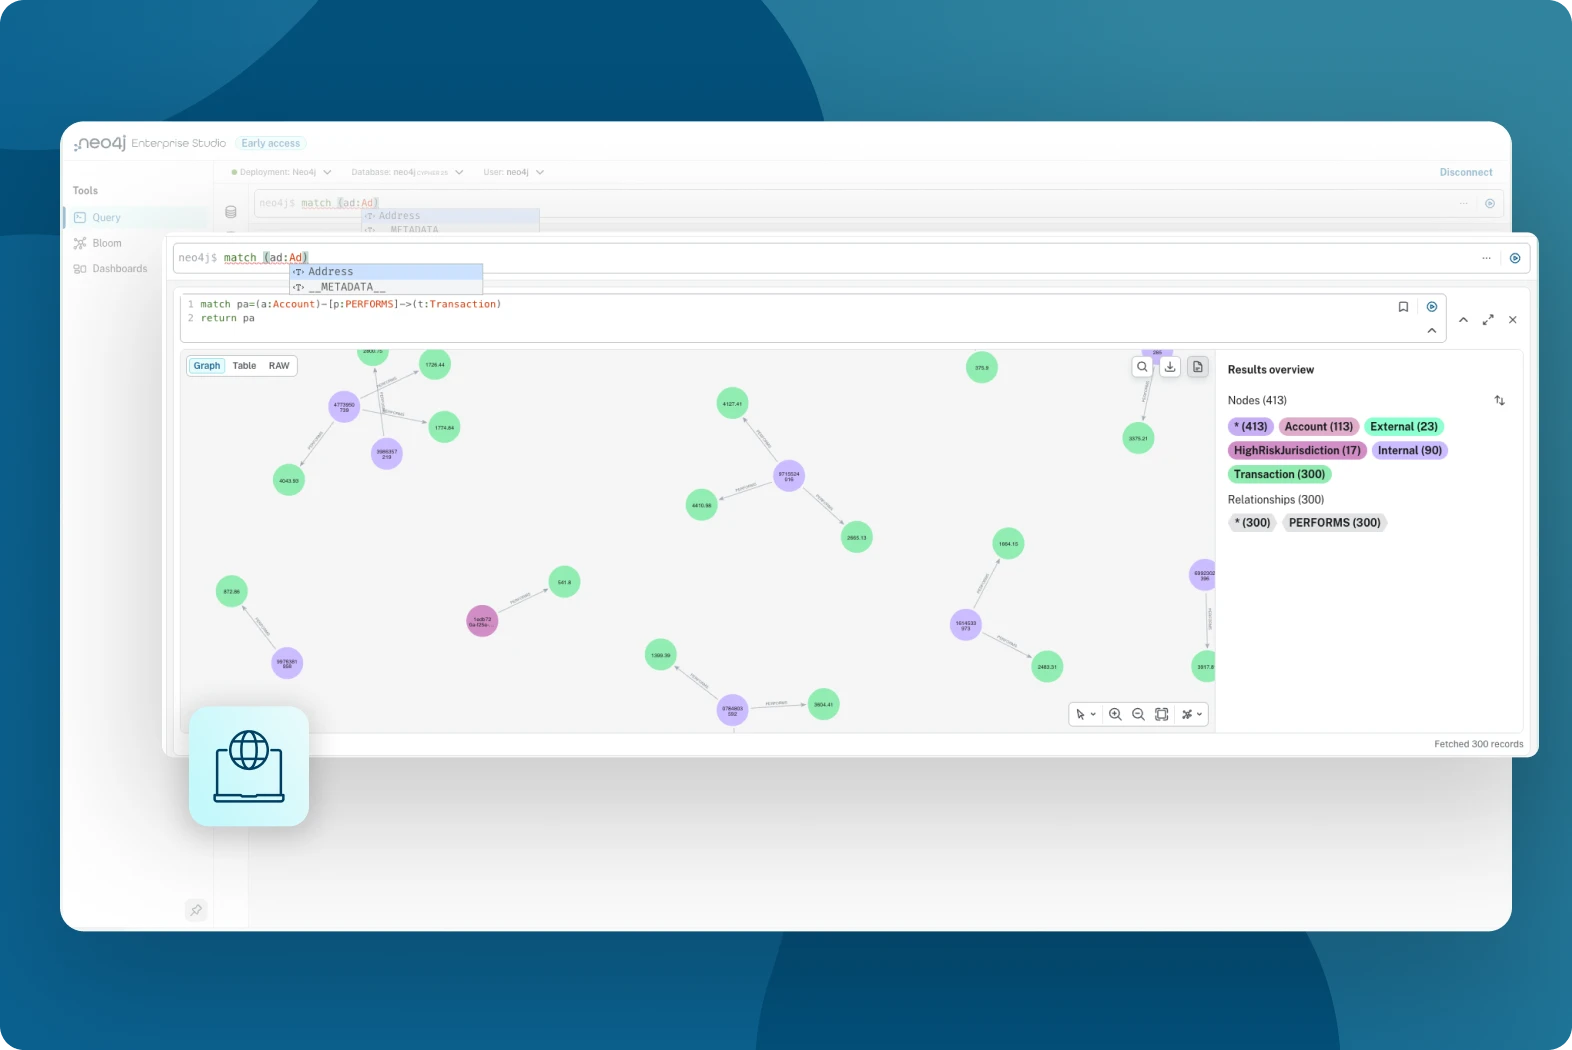
Query graph data
Interactively write, test, run, and share Cypher queries and scripts. See the results as an interconnected graph, in tabular format, or raw JSON.
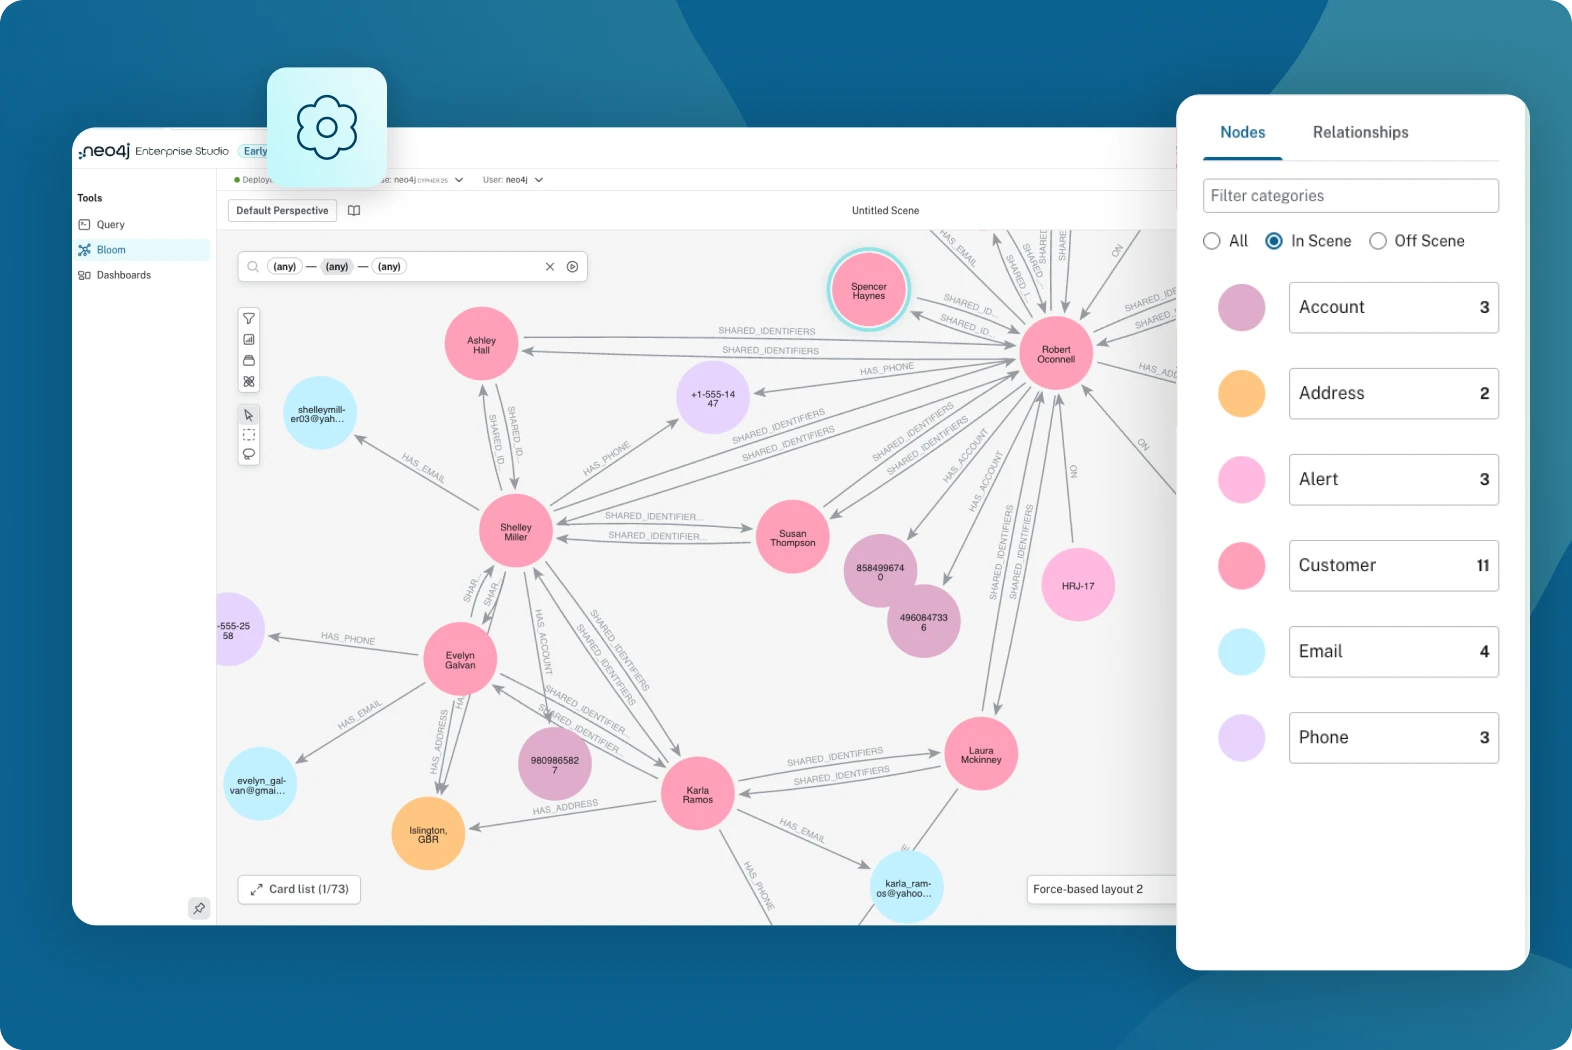
Visualize, explore, and investigate connected data without writing code
Visually explore your data through natural language search and point-and-click exploration. Uncover insights whether you’re a graph novice or expert when you use graph algorithms like community detection and centrality.
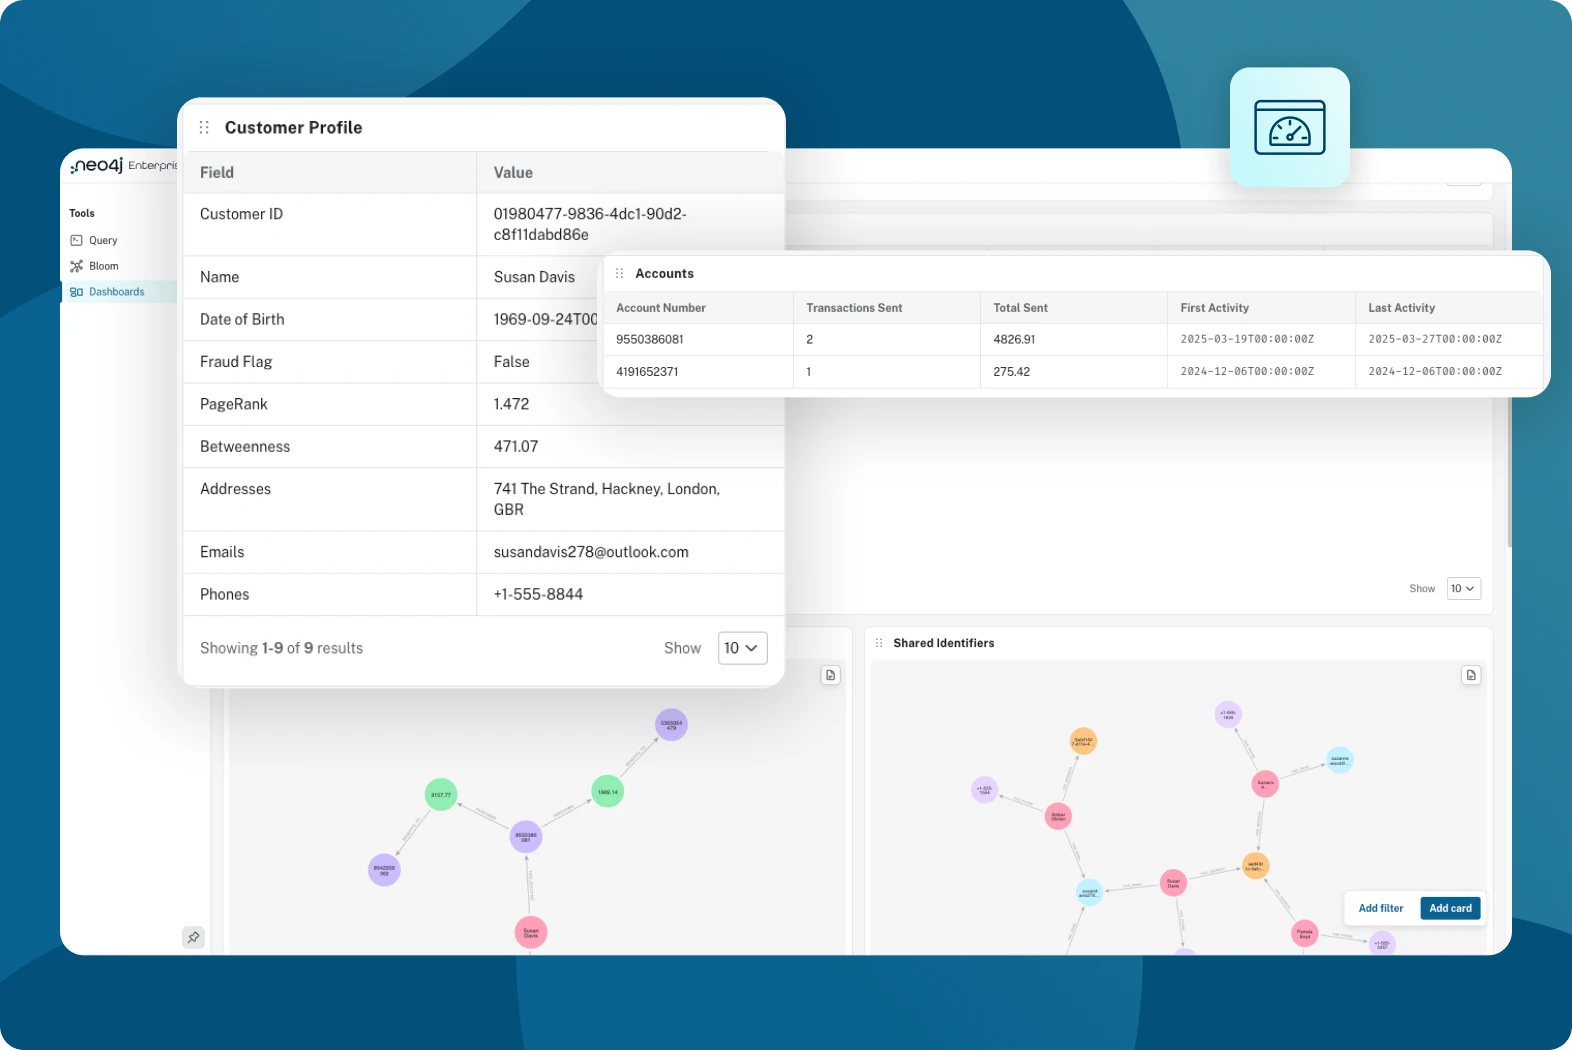
Build and deploy insightful dashboards
Build interactive dashboards to surface KPIs, drill into the details, and share insights with your team so everyone from analysts to business stakeholders can see what the data is saying.

Collaborate with teams
Control access to dashboards, visualizations (scenes), and queries based on user roles. Improve your productivity by collaborating with your company’s experts.
Powerful use cases
Optimize your projects with the Graph Database as a foundation.