A workbench for teams to query, explore, and visualize graph data


3 min read
If you’re building applications or working with connected data, you need tools. Tools for writing, debugging, and optimizing queries, creating rich dashboards, exploring and understanding data without writing code. Each activity has its own requirements and needs. You also don’t work in isolation; you collaborate with other colleagues to share expertise.
Cloud-based tools work for some, but others require strict control of the networks over which their data travels. Today, we’re announcing Neo4j Enterprise Studio, a secure workbench for the Neo4j Graph Database that includes all of these capabilities.
What we’re launching
This release provides three graph tools for Neo4j Graph Database customers who need the high security of a self-hosted deployment, including:
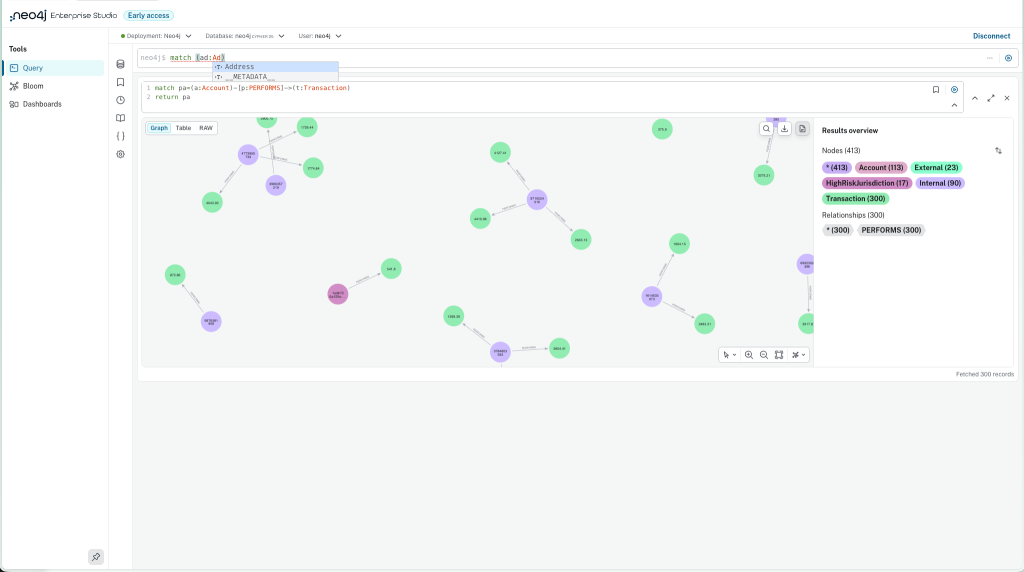
Query is a tool for developers to write, run, test, and optimize Cypher queries. Query results can be displayed in a rich graphical view or in tabular or JSON forms for detailed analysis of the results. Users can save and parameterize commonly used queries for easy recall. Query also includes a Cypher formatter and typeahead assistant that adapts to the Cypher language version of the Neo4j graph database.
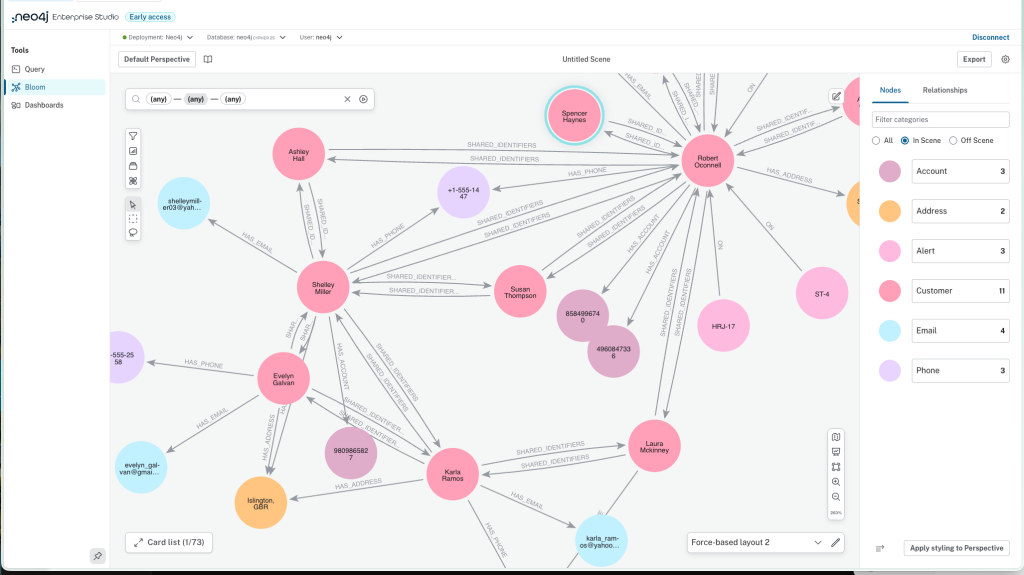
Bloom is an application for business users, subject matter experts, and developers to explore and understand graph data in a no-code interface. Users use point-and-click and plain language to find data and patterns, expand and understand relationships, and run pre-built data science algorithms for centrality, community detection, and label propagation.
Bloom offers rich visual styling, including colors, text styles, node sizing, and icons to create easy-to-understand visualizations of graph data that help you see what your data is saying.
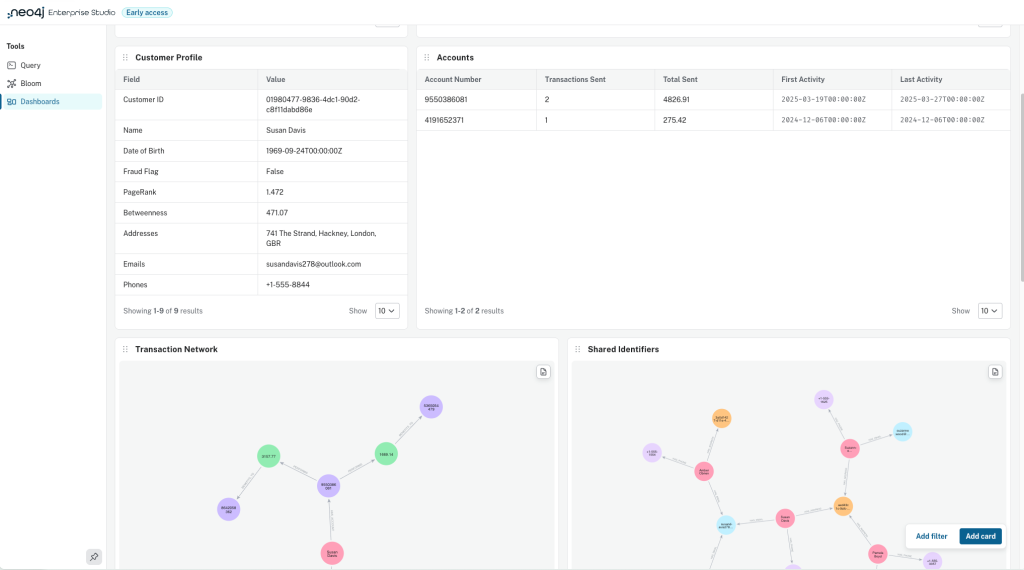
Dashboards enable analysts to create and share rich, interactive dashboards that bring insights to the surface and empower informed decision-making. Dashboards support visualizations such as tables, graphs, bar charts, line charts, maps, and more, enabling users to see trends, relationships, and other insights at a glance.
Collaborative and Secure
The Enterprise Studio tools not only work for individuals, but they also enable users to share artifacts with each other. Users can create Bloom perspectives, which include visual styling and saved queries, to define a “visual language” for displaying graphs; these perspectives can be shared with other users, enabling consistency across the team. Users can also share their dashboards with other users to either edit or view.
Because Enterprise Studio is self-managed, you control the deployment and can ensure that your data only passes through networks that meet your security requirements. It can be deployed in airgapped environments with no Internet access. Enterprise Studio supports authentication both at the database level and through your enterprise single sign-on.
Why this matters
The unified experience of having multiple tools together in one view enables users to move seamlessly from one type of work to another: test some Cypher code in Query or view a graph in Dashboards and switch to interactive analysis of the results in Bloom. Tested and debugged code in Query can be immediately moved into a Dashboard widget.
The insights and context driven by connected data are available regardless of your deployment choices. Customers installing and managing their own Neo4j deployments have the same single-pane-of-glass tools available as fully-managed Neo4j AuraDB customers and developers using Neo4j Desktop. The Studio experience is consistent regardless of deployment approach.
Get started
Enterprise Studio product page
Learn more by joining our LinkedIn Live
Share Article


Explore
Related Articles

1 of 3: The difference between a graph, a knowledge graph, and a context graph

2 of 3: Why graphs, knowledge graphs, and context graphs matter to customers
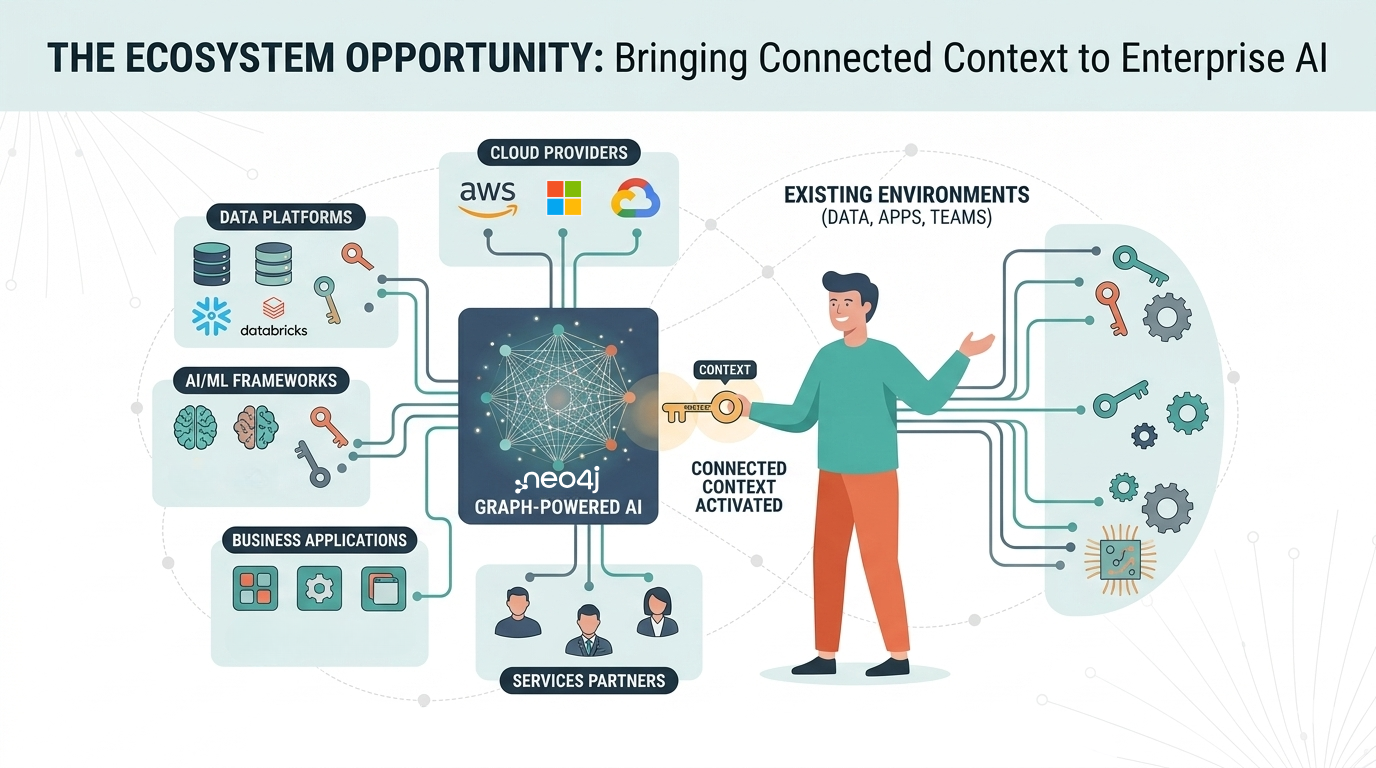
3 of 3: The graph ecosystem: Bringing connected context to enterprise AI
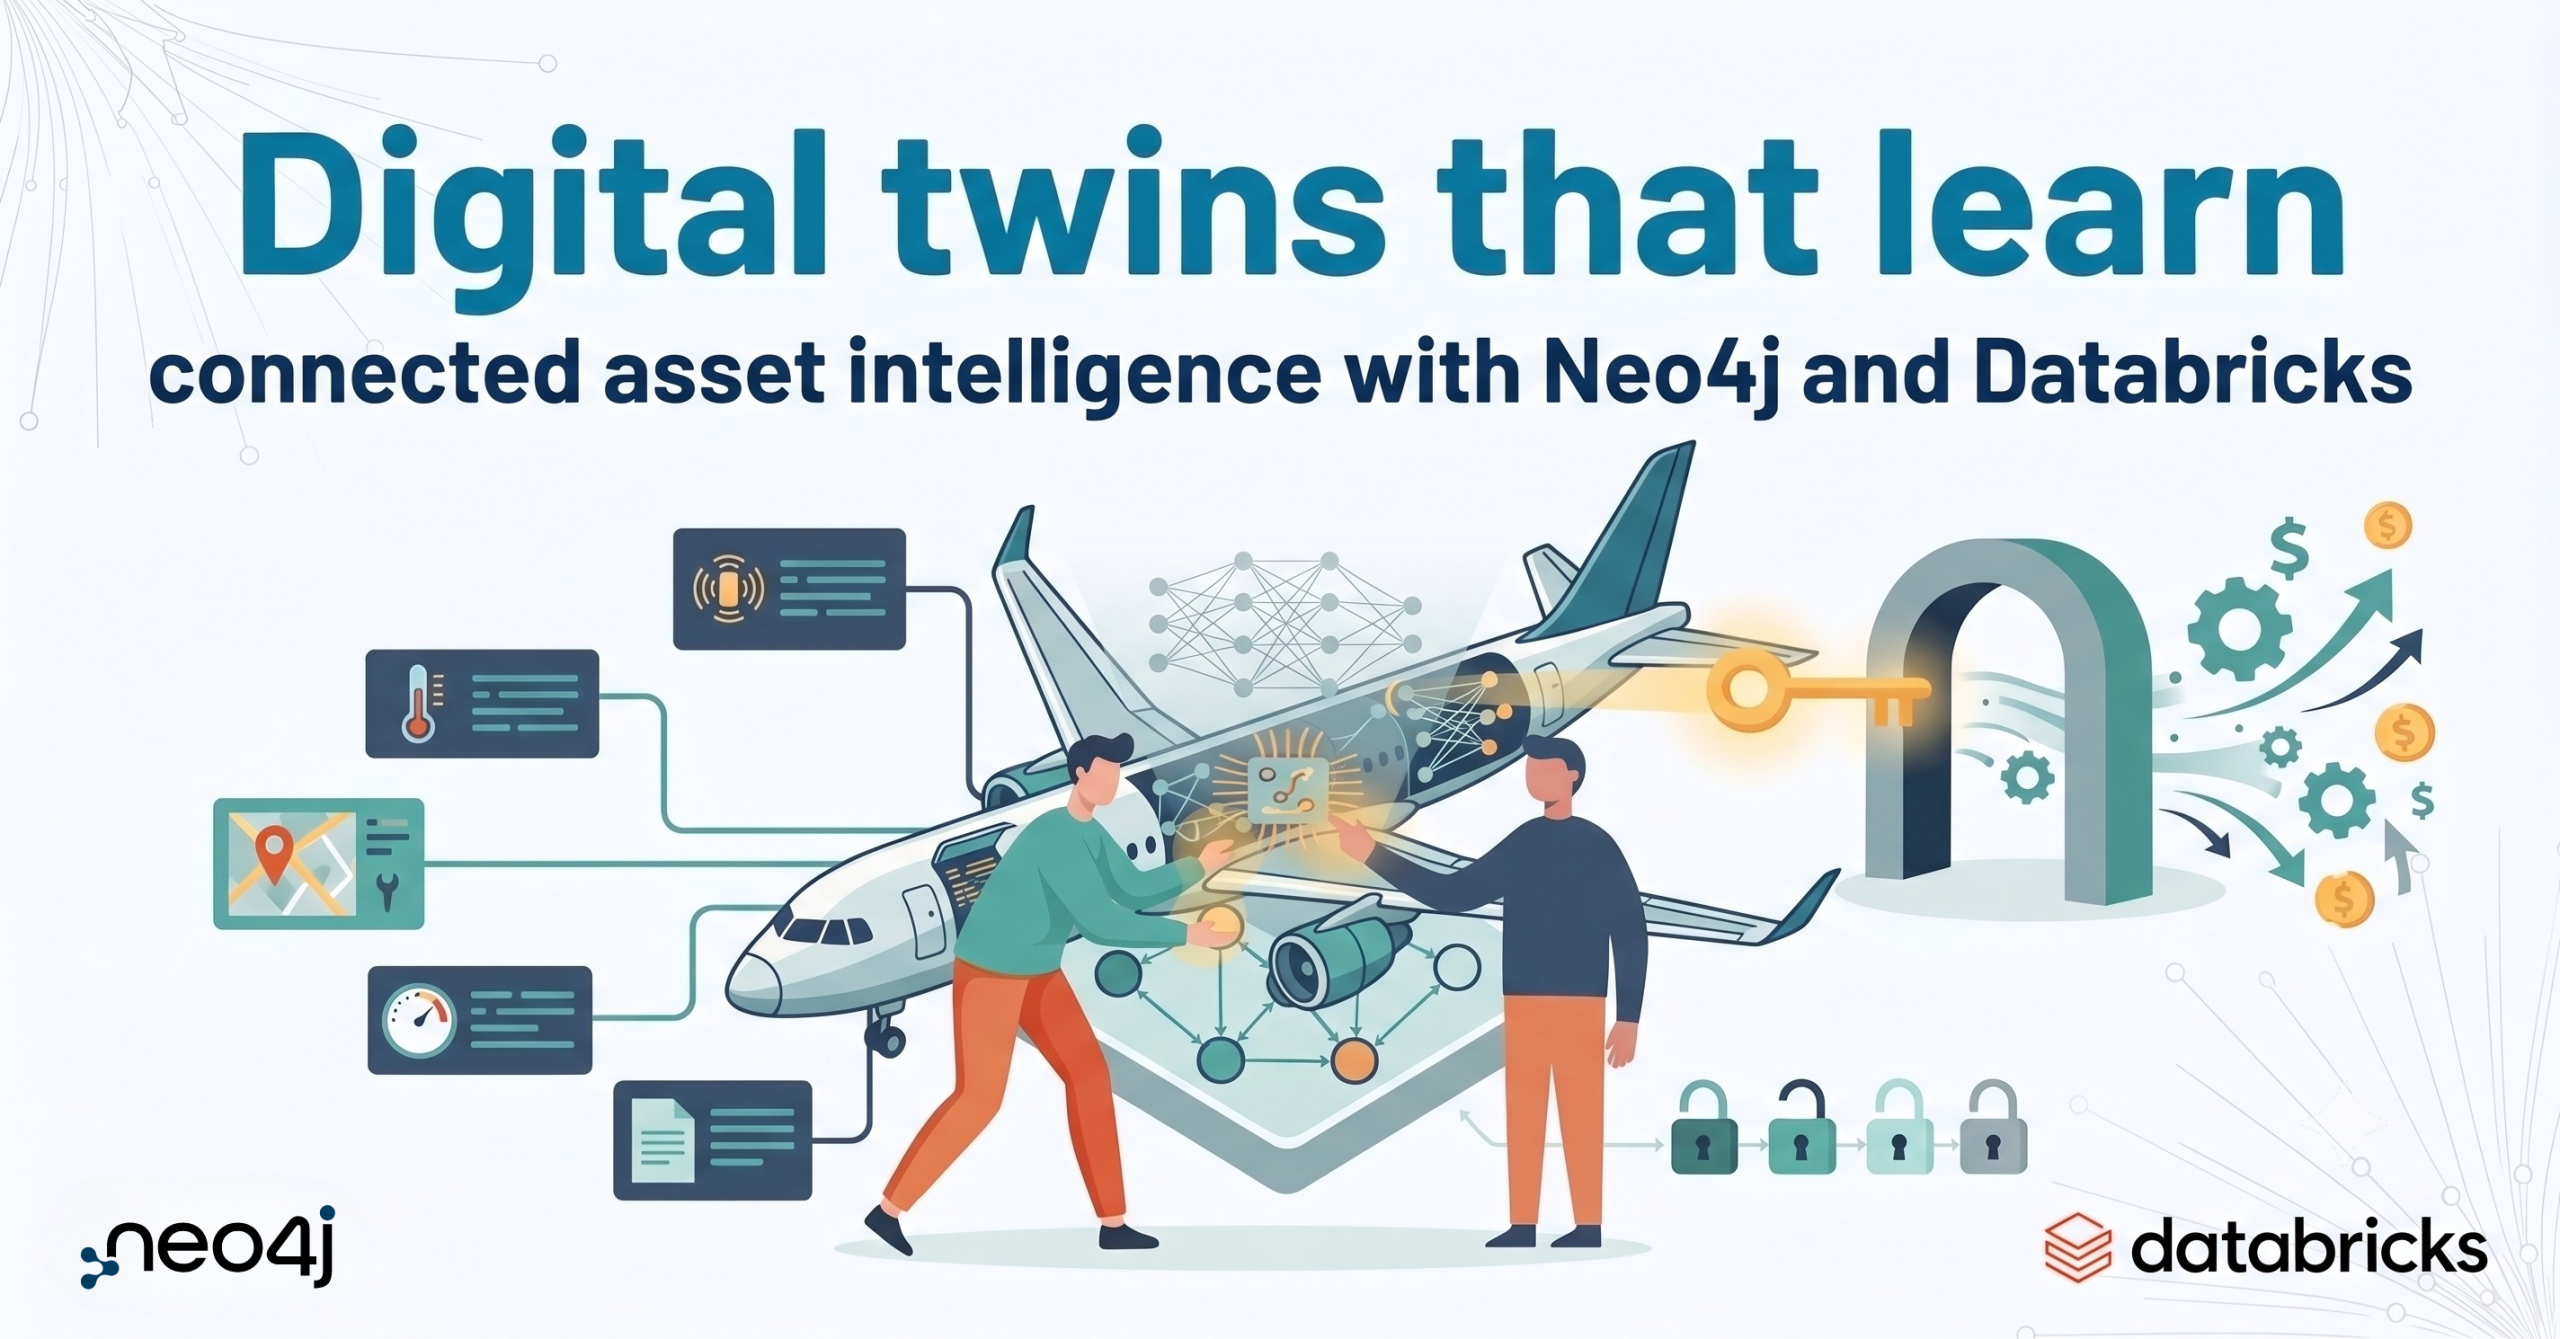
Digital twins that learn: connected asset intelligence with Neo4j and Databricks
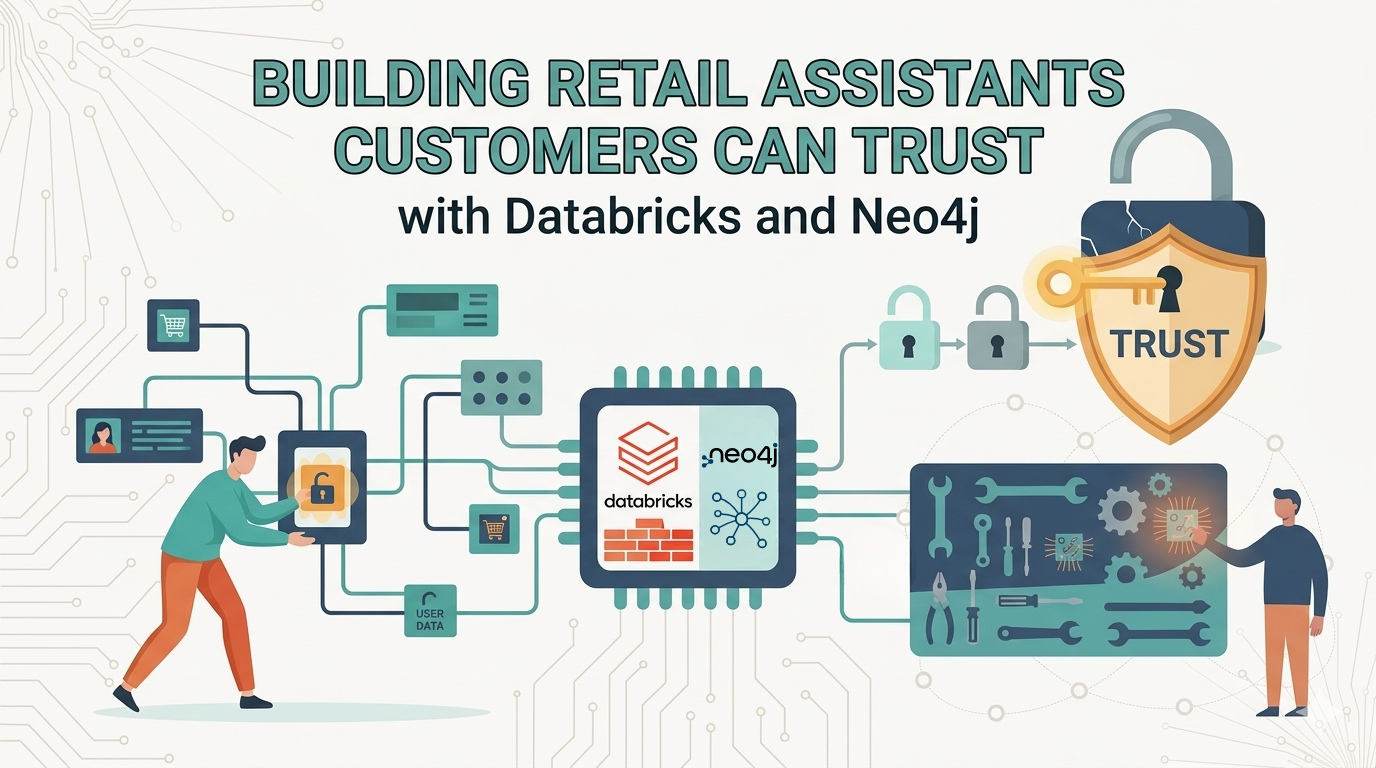
Building retail assistants customers can trust with Databricks and Neo4j