


Summary
Himmelstein started his PhD research with the question: How do you teach a computer biology? He found the answer in a heterogenous network (a.k.a., “HetNet”), which turned out to be another term for a labelled property graph.
After an attempt to create his own Python package for querying HetNets, Himmelstein turned to Neo4j. By importing open source drug and genetic information, he has developed a graph with more than 2 million relationships that can be mined for drug repurposing – in other words, finding new treatment uses for drugs that are already on the market – via a growing dataset of matching compound-disease pairs.
For each of the current 200,000 compound-disease pairs, his project computes the prevalence of many different types of paths and then uses a machine learning classifier to identify the patterns of the network, or the paths, that are predictive of treatment or efficacy. As an example, Himmelstein shows you how his HetNet project helped identify bupropion as a drug that not only treats depression but also nicotine dependence.
Integrating all of Biology into a Public Neo4j Database
What we’re going to be talking about today is developing a heterogenous network for biological data so that we can discover new treatment uses for existing drugs:
How to Teach a Computer Biology
I started my PhD with the question: How do you teach a computer biology? What’s the best way to encode biological and medical knowledge into a computer in a way that the computer can operate and understand that information?
It quickly became clear that for both me and the computer, the most intuitive way would be through networks with multiple nodes or relationship types. But we had a problem: there were at least 26 different names for this type of network, such as multilayer network, multiplex network, overlay, composite, multilevel and heterogeneous network.
The studies we built off of most often used the term “heterogeneous information network.” But we thought the name was too long — and that no one would ever want to work in a field with that name.
So what do you do when you have 26 different terms that you don’t like? You make it 27.
We call our data structure a HetNet, which is short for heterogeneous network. The Neo4j community often refers to the labelled property graph model, and this is really the same thing. The difference is that HetNet focuses on the fact that every node and relationship has a type. And that’s what we wanted to bring to biomedical study that hadn’t been there previously.
HetNet: Choosing the Right Software
The next question was: What is the best software for storing and querying these HetNets?
Hetio was a piece of a Python package that I created, and over the years, it has accumulated 86 commits, has five GitHub stars and two forks. And I don’t like doing work, so when I learned that the Neo4j project offered the same functionality and more — with 42,000 commits over 3,000 stars and one 1,000 forks — I realized it was a thriving community I wanted to be a part of.
The next step was putting biology into Neo4j. We did that last July by releasing Hetionet Version 1.0, which is a HetNet of biology designed for drug repurposing — which is finding new uses for existing drugs. It’s often much cheaper and safer to find a new use for drugs that we already know are safe for humans, rather than designing a new compound from scratch.
This network has 50,000 nodes of 11 types — which we would call labels in Neo4j. Between these 50,000 nodes are 2.25 million relationships of 24 types.
To build this network, we integrated knowledge from 29 public resources, which integrated information from millions of studies. This means that a lot of our relationships will point back to the studies that the information came from. A lot of this information was extracted through manual curation, by third parties or text mining, or big genomic experiments or sequencing.
The hardest part was the licensing of all this publicly available data. A lot of people don’t realize that just because you have access to a piece of data online doesn’t mean you can use it, reproduce it or give it away however you want. Nature News wrote an article on this called, “Legal maze threatens to slow data science.”
If you’re releasing data online and you want people to be able to use it, make sure to put an open license that allows them to do so.
The Hetionet Metagraph
Below is our metagraph, which also goes by the name data model or schema:
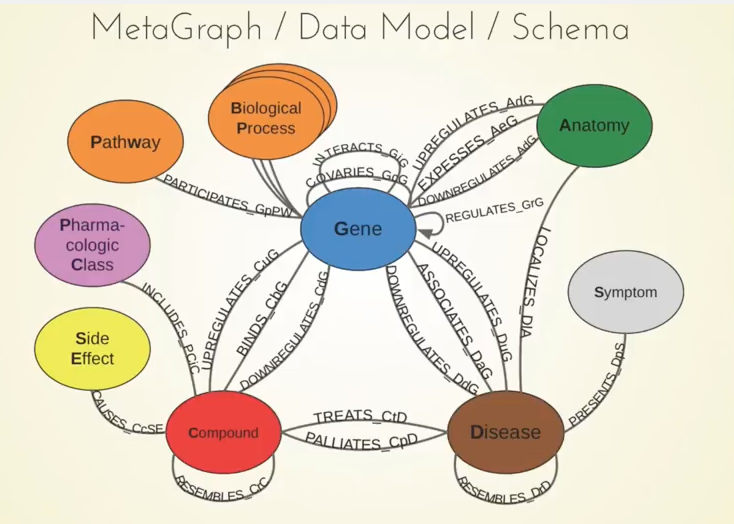
You can see the 11 different types of nodes and the 24 types of relationships here. Something important to note are the compounds and the diseases, and we know currently what compounds are known to treat what diseases.
We also included information about genes. For example, when a compound binds a gene, that refers to when the compound physically attaches to the protein which is encoded by that gene.
Another example is when a gene associates with the disease. This means that genetic variation in that gene influences your susceptibility to a certain disease, and there have been big studies called GWA studies — thousands of them — which have given us a rich catalog of these relationships between genes and diseases. The network also contains many other types of relationships.
It’s hard to visualize a HetNet, but below is our best attempt:
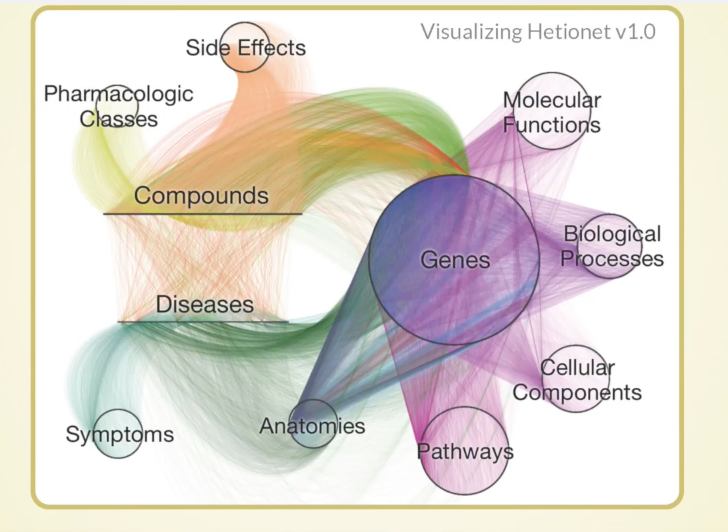
Each node is a tiny little dot and laid out either in a circle, or in a line, for the compounds and diseases. Each relationship is a curved line colored by its type. This is a bird’s eye view of one way of looking at a HetNet, which should help you understand what we’re dealing with.
Without a good graph algorithm, it would be very hard to tell anything about it. But with Cypher, we can do intelligent local search and machine learning to do cool things.
We host this network in a public Neo4j instance, and as far as I know we are the only people hosting a completely public Neo4j instance. We use a customized Docker image to deploy it on a DigitalOcean Droplet, and it has SSL from letsencrypt. It’s a read-only mode with a query execution timeout, and it has a custom display node visual style and custom Neo4j Browser guides to point our users to cool things.
Below is a demo of the guide we’ve created:
The Rephetio Project
We tried to apply this to drug repurposing in a project we code-named Rephetio.
Hetionet Version 1.0 contains about 1,500 connected compounds and 136 connected diseases, which between them provides over 200,000 compound-disease pairs. Each compound-disease pair is a potential treatment, and we want to know the probability of whether or not it has drug efficacy. We do currently know about 755 treatments, and these are for diseases your doctor would give you a medication for.
The way we decided to understand the relationship between a compound and a disease is to look along certain types of paths that we call metapaths. If you look for the different types of paths that can connect a compound to disease with a length of four or less, there are 1,206 of them based on our metagraph. Even though this is a lot of computation, we were able to run it.
So, for each of these 200,000 compound-disease pairs, we compute the prevalence of a bunch of different types of paths and then use a machine learning classifier to identify the patterns of the network, or the paths, that are predictive of treatment or efficacy.
Through that, we’re able to predict the probability of treatment for all 200,000 compound-diseased pairs. These predictions are online, and you are free to use them however you’d like.
What we found very cool is that those 755 known treatments were ranked very highly by our approach, as you can see by how this violin plot is weighted in the high percentiles:
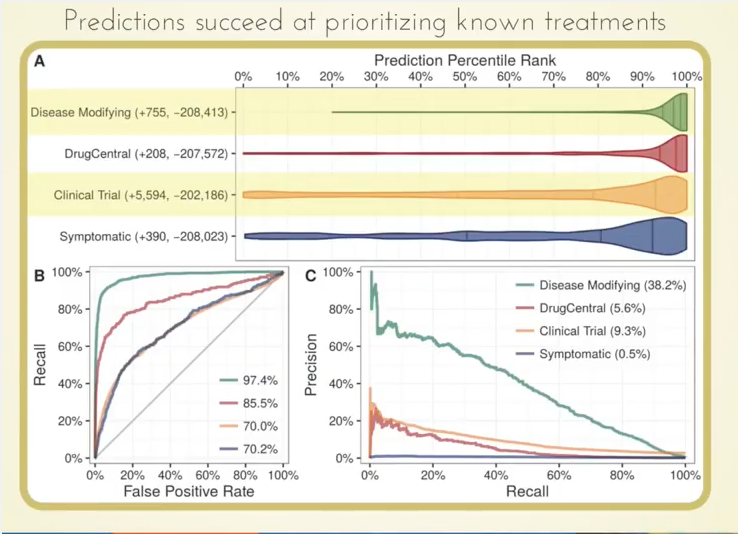
Even more interesting potentially is that we were able to highly prioritize drugs currently in clinical trials based on our predictions.
An Example: Bupropion
Let’s get to a specific example with bupropion, along with our question: Does it treat nicotine dependence?
It was first approved for depression in 1985, but due to the serendipitous observation that people taking the medication for depression were also less likely to smoke, it was approved in 1997 for smoking cessation. So we asked, “Can we predict this using our network, and what is the basis of that prediction?”
We happened to score this treatment highly: It was in the 99.5th percentile for nicotine dependence, a probability 2.5-fold greater than we’d expect.
Some of the paths that our approach predicts to be meaningful are that bupropion causes terminal insomnia as a side effect, which is also caused by Varenicline — another approved treatment for nicotine dependence.
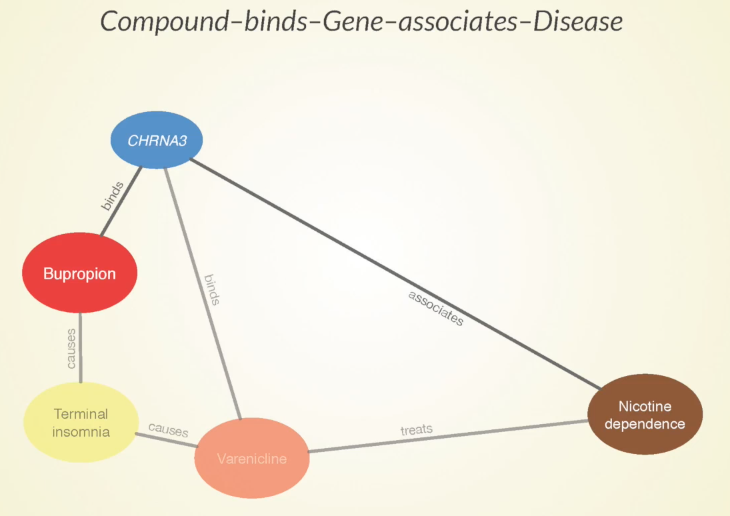
Sometimes when two drugs share a specific side effect, it’s because they have a similar mechanism of action and that could be harnessed for a potential future treatment. Bupropion binds to this CHRNA3 gene which is also bound by varenicline – more evidence that these two drugs could be doing something similar.
Furthermore, there’s an association between the gene and nicotine dependence, which gives a good indication that that gene has some involvement in the disease.
And then, we have many pathways which this gene participates in:

The pathways are the orange circles that other nicotine dependence associated genes participate in, so these are the ten paths that our approach finds most supportive of this prediction.
And you can see this in the Neo4j Browser in an interactive way — watch the demo below:
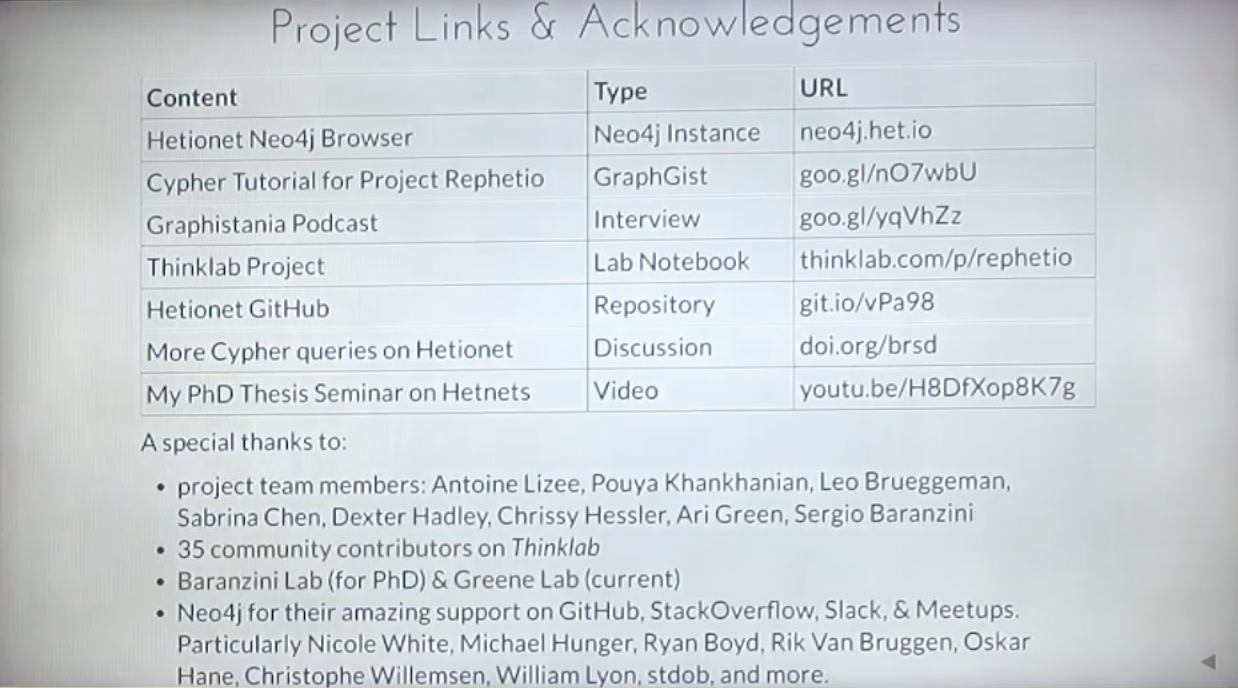
A lot of special thanks to everyone who helped me with this project, especially all the people at Neo4j who helped me on Stack Overflow and GitHub. It’s really been a fantastic community to be part of, and there are a lot of resources below:
Inspired by Daniel’s talk? Click below to register for GraphConnect New York on October 23-24, 2017 at Pier 36 in New York City – and connect with leading graph experts from around the globe.
Register for GraphConnect
Register for GraphConnect


