


Yes, I’m talking about a digital road trip. This summer I will rock the world of healthcare using Neo4j to see how each group of stakeholders connect to each other. You are welcome to join me if you are wondering what interesting discoveries I will find and curious how to use a graph database to uncover your own adventurous world. Now, let’s go!
Unlock the World: Data Is Your Magic Tool
No one can deny that among all the major industries in the U.S., healthcare is one of the most complicated in that it involves a wide range of stakeholders from providers to drug manufacturers to legislators as well as patients. Coming from a medical background, I am extremely interested in discovering how each party plays their roles and influence the whole industry.
My journey of exploring the healthcare industry started with a whiteboard. In a sunny laidback afternoon, me and my friends were discussing who plays a role in the healthcare industry and we started to draw each party with their relationships on a whiteboard. The graph started like this:
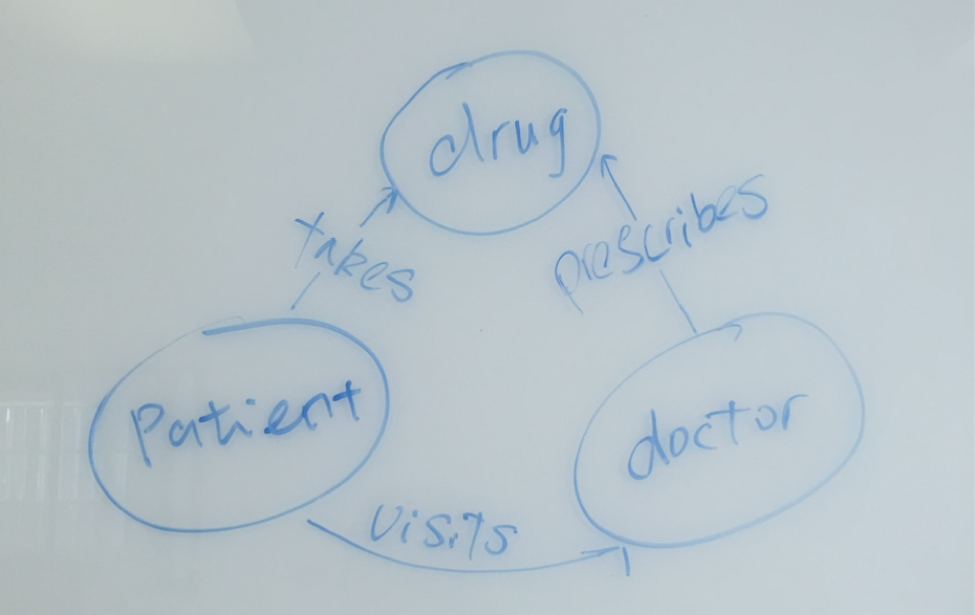
After 10 minutes of discussion, the graph grew into something look like this:

Now this looks amazing! The left part of the graph demonstrates the procedures of a clinical encounter between a patient and a provider, the right part of the graph represents the relationships among different stakeholders.
My initial curiosity lies in the right side of the graph, and I am pretty sure there are a lot of public datasets that I can use. By creating a graph database, I am hoping to answer interesting questions such as:
- Tracking prescription drug abuse history by states, hospitals and providers
- Tracking Medicare Part D costs by drugs, providers and states
- Looking for lobbying history specifically for individual drug manufacturers and lobbyist information
Well, that doesn’t sound fun, and I don’t want to spend my summer in writing long and complicated SQL queries. But wait, I could totally represent the system in a graph database just like how I drew it all out on a whiteboard!
I spent the next few days teaching myself how to data modeling for a graph database using this awesome online tutorial. Check it out if you are interested, but I am going to show you what I did to model the data in a graph database.
First and Foremost, Draw out the Domain
Searching for the right data is like looking for a piece of a leaf in the wild jungle. By first drawing out the general graph of the system that I am trying to modeling, it gives me the idea of which types of trees I need to look for, so to speak.
In my project, I quickly identified data related to drugs, drug manufactures, providers and lobbyists that are essential for me to construct the system.
Second, Document What is Available
Knowing the targets, I quickly started my journey of data collection. There is no magic about how to quickly locate the targets other than using Google.
After a few days of data collection along with further studying about each stakeholder of the healthcare industry (Wikipedia always answers my questions), I found a few major sites where I can download the data that I need:
| Data | Type | URL |
|---|---|---|
| Provider Prescriptions | CSV | https://www.cms.gov/Research-Statistics-Data-and-Systems/Statistics-Trends-and-Reports/Medicare-Provider-Charge-Data/Part-D-Prescriber.html |
| Provider Enumeration System | CSV | https://download.cms.gov/nppes/NPI_Files.html |
| FDA Drug Codes | CSV | https://www.fda.gov/Drugs/InformationOnDrugs/ucm142438.htm |
| Drug Manufacturers | CSV | https://www.fda.gov/drugs/informationondrugs/ucm135778.htm |
| Lobbying Disclosures | XML | https://disclosures.house.gov/ld/ldsearch.aspx |
| Lobbying Contributions | XML | https://disclosures.house.gov/lc/lcsearch.aspx |
| Congress, Legislators & Bills | Other | https://www.govtrack.us/developers |
Modeling data in a graph database requires a thorough understanding of both the context as well as the characters of the data. Having the data sources helps me to better define the domain of my model:
- A healthcare provider prescribes drugs
- A drug manufacturer produces drugs
- The drug manufacturer hires a lobbying firm, which files a disclosure
- The lobbying disclosure relates to one or several issues
- The lobbying firm makes contributions to a Congress representative’s campaign
Third, Answer Two Questions to Refine Your Model
Having a definition of the domain is still not sufficient to identify the nodes and relationships in a graph model. It’s worth taking a moment to look in detail of the data that I found.
The general idea of mapping data from an RDBMS to a graph is that rows are usually treated as nodes, columns are properties and keys are relationships between nodes. Here are a few screenshots from the “Introduction to Graph Databases” online training course that demonstrate this data modeling process:
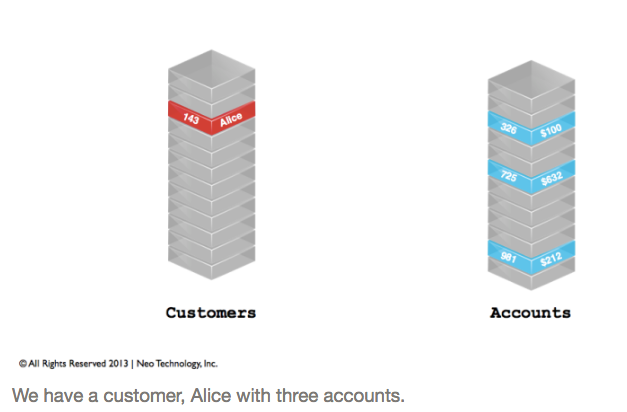
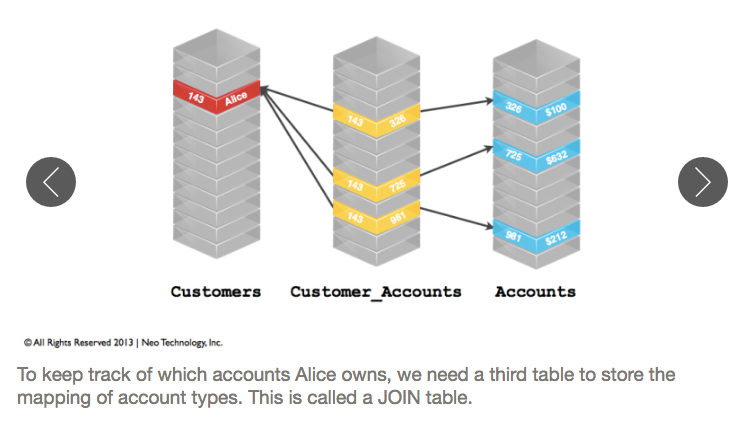

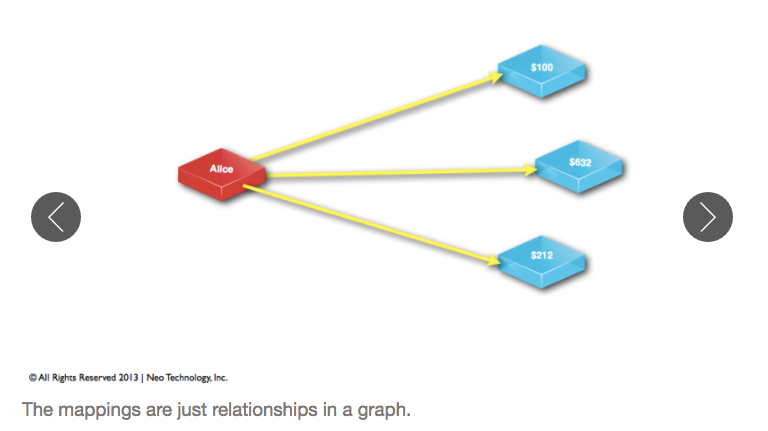

When looking at the details of your datasets, answering these two questions is helpful to convert RDBMS tables into a graph data model:
- Do the two tables contain columns that share the same values?
Answering this question is helpful to link two nodes together. The question is easy to answer if you could find the key columns in both tables. But what if the two tables don’t share a foreign key? Then it’s good to document which columns in the tables represent the same object.
For example: Provider prescription data doesn’t contain FDA drug codes (which can be used as a foreign key). However, both provider prescription data and FDA drug code data contains columns ofbrand_nameandgeneric_name, thus I’m able to link these two tables together bybrand_nameandgeneric_name. - Which columns (i.e., properties) can be extracted as an independent node?
Remember that columns are usually treated as properties? But sometimes you may want to create a node for some columns, and doing so can be beneficial when querying your data.
For example: In the lobbying disclosure data, a lobbying firm can be treated as a property of theDisclosurenode, but it can also be extracted as an independent node which has a relationFILEDpointing toDisclosureand another relationLOCATED_INto theStatenode.
A good reason for treating the lobbying firm as a node rather than a property is that the lobbying firm contains a lot of information such as:name,houseIDandlocationwhich can be stored as properties for that node. Another reason, perhaps more beneficial, is that it allows you to create a relationship between lobbying firm and state, thus offering the option to query “which lobbying firms and drug manufacturers are located in the same state”.
Last, Create the Graph Schema
Although the graph database is schemaless, it’s good to have a clear idea of how your data will be stored in a graph before you create the database, and solid schema documentation will be really helpful for later development. Here is the graph I created after studying both the context and the characters of the healthcare dataset:

I created this graph in only a few minutes using the Arrows tool (created by Alistair Jones).
I hope you found the first week of our Neo4j healthcare road trip exciting! Starting next week, I will show you how to ETL the data into Neo4j. As you have seen, there are two types of data in my project: CSV and XML, I will start to extract XML data by calling APOC which stands for “Awesome Procedures On Cypher” and load the data into Neo4j by using the py2neo package in Python.
I’ve also linked the project’s GitHub repository here where you can find the detailed schema documentation, current code development and some other fun stuff.
Want to learn more about graph databases and Neo4j? Click below to register for one of our online training classes, Introduction to Graph Databases or Neo4j in Production and catch up to speed with graph database technology.
Catch up with the rest of the Neo4j in healthcare series:


