


Hi graph gang,
In this week’s video, Greg Woods teaches us all about the new reactive Neo4j drivers.
Alicia Frame officially launches the Graph Data Science Library and Tomaz Bratanic shows us how to use it with the help of two datasets.
Rik continues his journey in the world of supply chain management and Lucas Moda shows how to create a graph of Sao Paulo’s subway system.
Featured Community Member: Steven Mogg
This week’s featured community member is Steven Mogg, Solution architect at OGA.

Steven Mogg – This Week’s Featured Community Member
Steven is a graph nerd and consultant at Mentum Systems Australia, where he has a focus on governance, risk, semantic web and business management information systems.
He is an active part contributor in the Neo4j community and an advocate for graphs and graph thinking in his local community in Canberra, Australia. For two years in a row, he was one of the organizers for Global Graph Celebration Day, helping expand graph thinking around the world.
But don’t take our word for it, he said it himself in his post about GGCD when he said, “We celebrated [GGCD] help share the power of the graph and maybe bring one or two more into the wonderful world of knowledge graphs”
Steven, we admire your passion and are so grateful for your intentful contributions to open the eyes of others to how graphs can change the world! Thank you for being a part of the community. We look forward to doing more powerful things together with you in the years to come!
Reactive Database Connections with Neo4j Drivers
This week’s video is Greg Woods’ presentation about Neo4j Drivers from Neo4j Tech Talks, hosted on 7th April 2020.
In the video Greg explains reactive programming and reactive streams, and then presents examples of how these concepts have been implemented in the 4.0 version of Neo4j drivers.
Supply Chain Management with graphs: Part 3 – SCM analytics

Rik Van Bruggen continues his series of blog posts about supply chain management with graphs.
In part 3 Rik executes analytics queries against the dataset, using both Cypher’s in-built variable path query capabilities as well as centrality algorithms in the Graph Algorithms Library.
This Week in Graph Data Science
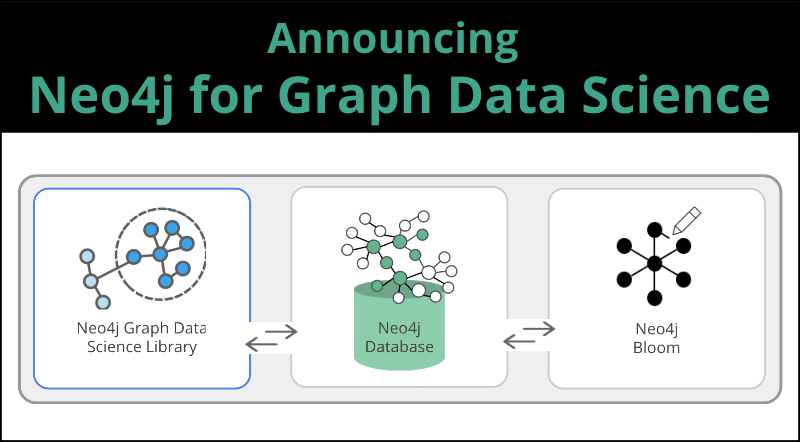
On Wednesday Alicia Frame, Lead Product Manager of Data Science at Neo4j, announced the official launch of the Graph Data Science (GDS) Library.
The GDS library provides data scientists with a library of parallelized, robust graph algorithms that quickly compute over very large graphs. It replaces the Graph Algorithms Library that was launched in 2017.
Tomaz Bratanic has also written a couple of blog posts showing how to use it:
- In the first post, he does a deep dive into multi graphs and explains how to use them in GDS.
- And in the second, he combines multi algorithms, including Connected Components, Louvain, and Cosine Similarity, to make sense of the CIA’s World Factbook.
GraphQL resolvers deep dive, SDN RX + JDK 14, Query Neo4j with SQL
- Michael Simons shared the neo4j-examples-record-movies repository, which has examples showing how to use Spring Data Neo4j RX with JDK 14.
- Michael also presented a Twitch live stream in which he showed how to use the Java driver using JShell and Spring Boot. The code from that session is in the neo4j-twitch repository.
- William Lyon has written a deep dive into the GraphQL resolvers used in the GRANDstack.
- Adam Cowley published an update for vue-neo4j with some improvements to the <vue-neo4j-connect> component. If you are in Desktop mode it will display a list of Projects and Graphs, otherwise you will get a login form.
- M. David Allen wrote a blog post showing how to query Neo4j with SQL.
Using Neo4j and Cypher to reproduce São Paulo’s subway system
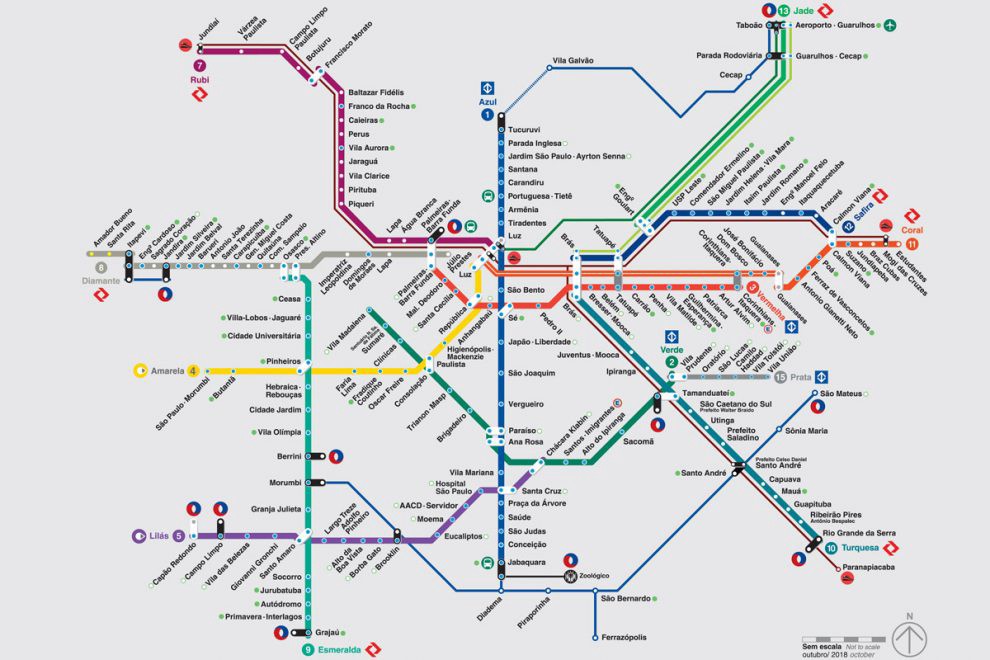
Lucas Moda has written a blog post showing how to create a graph of the subway system in São Paulo.
Lucas gives a Cypher crash course, before showing how to import data about São Paulo’s train stations, and concludes with some shortest path queries executed with the py2neo library.
The code used in the blog post is available in the graph-subway GitHub repository.
Tweet of the Week
My favourite tweet this week was by Markus Günther after watching Michael Simons’ Twitch live stream.
Thank you for doing this. I've wanted to play around with Neo4J for quite some time now, but as time is limited, I didn't get to it yet. Your session gave a good introduction on how to hook things up properly and start toying around with Neo4J. Much appreciated!
— Markus Günther (@markus_guenther) April 8, 2020
Don’t forget to RT if you liked it too!


