Gauge Chart
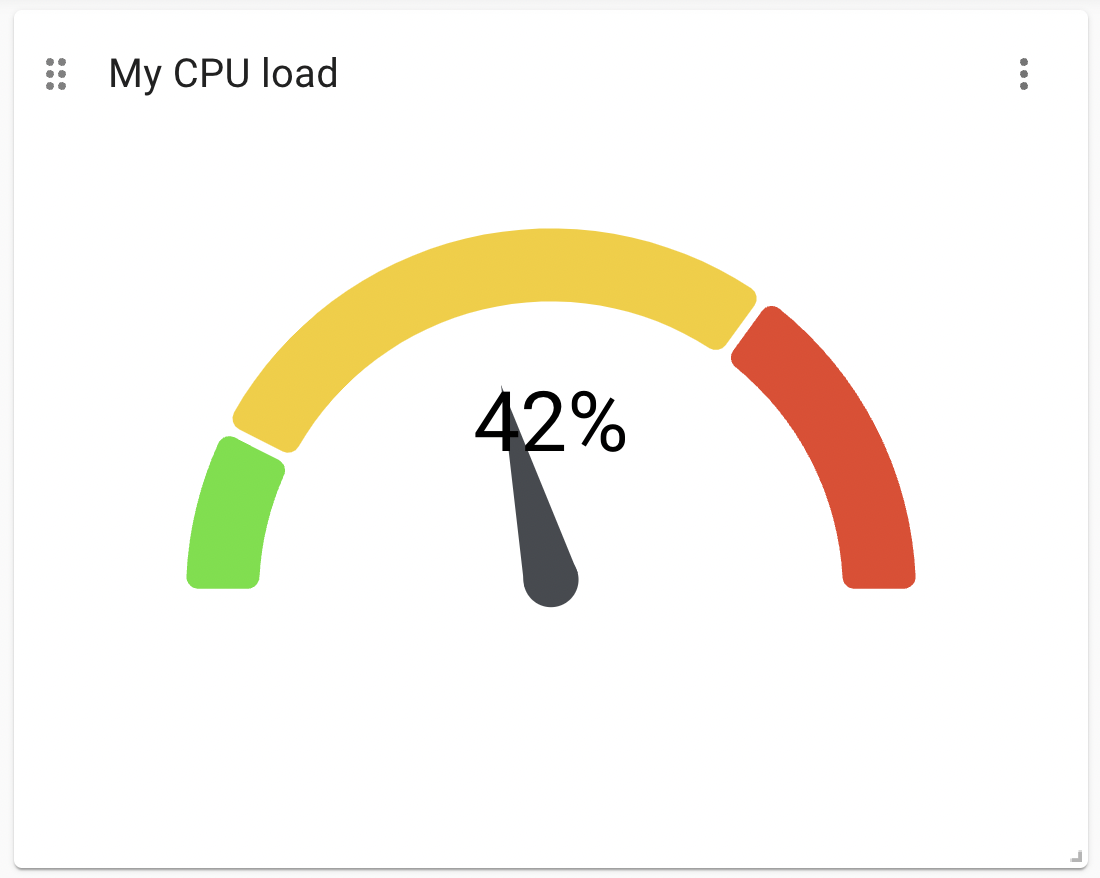
A gauge chart takes a single numeric value, and plots it on an animated gauge:
-
The value returned should be in the range of 0 to 100.
-
The gauge chart can be customized with different colors and levels (arc segments).
Advanced Settings
| Name | Type | Default Value | Description |
|---|---|---|---|
Number of levels |
number |
3 |
The number of distinct colored levels in the gauge. |
Comma-separated length of each arc |
List |
"0.15, 0.55, 0.3" |
A comma-separated list of length for each of the colored arc segments on the gauge. |
Comma-separated arc colors |
List |
"#5BE12C, #F5CD19, #EA4228" |
The HEX color values to assign to each arc. |
Color of the text |
string |
black |
The color of the number on the gauge. |
Delay in ms before needle animation |
number |
0 |
Delay in milliseconds before starting the animation. |
Duration in ms for needle animation |
number |
2000 |
The duration of the moving needle animation when the chart renders. |