Rule-Based Styling
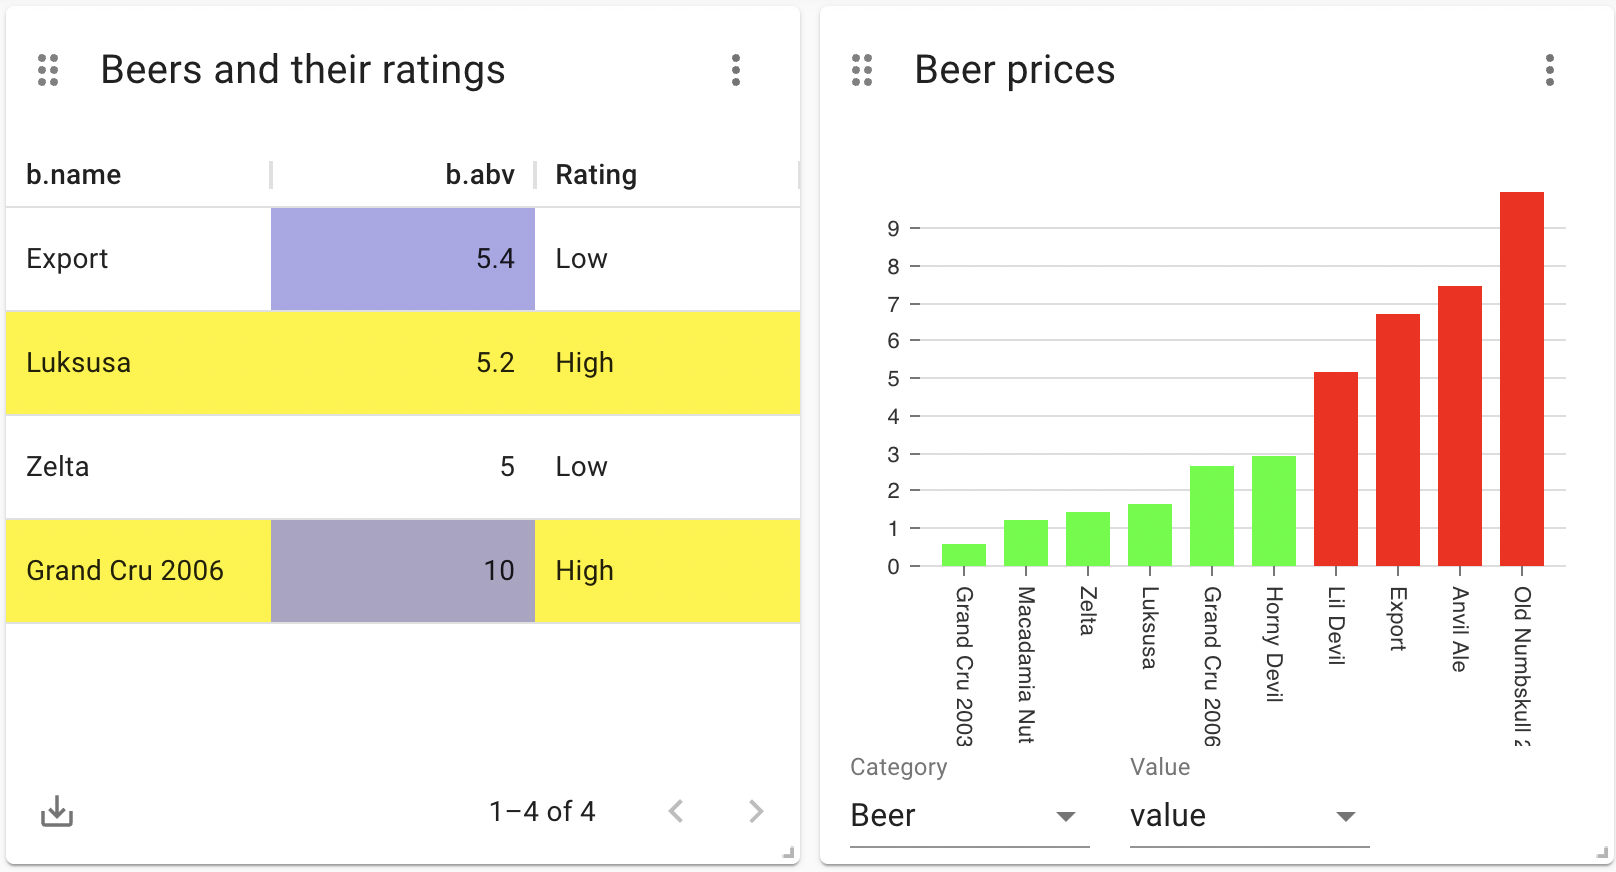
The rule-based styling extension allows users to dynamically color elements in a visualization based on output values. This can be applied to tables, graphs, bar charts, line charts, and more. To use the extension, click on the 'rule-based styling' icon inside the settings of a report.
Configuration
First, ensure that the extension is enabled.
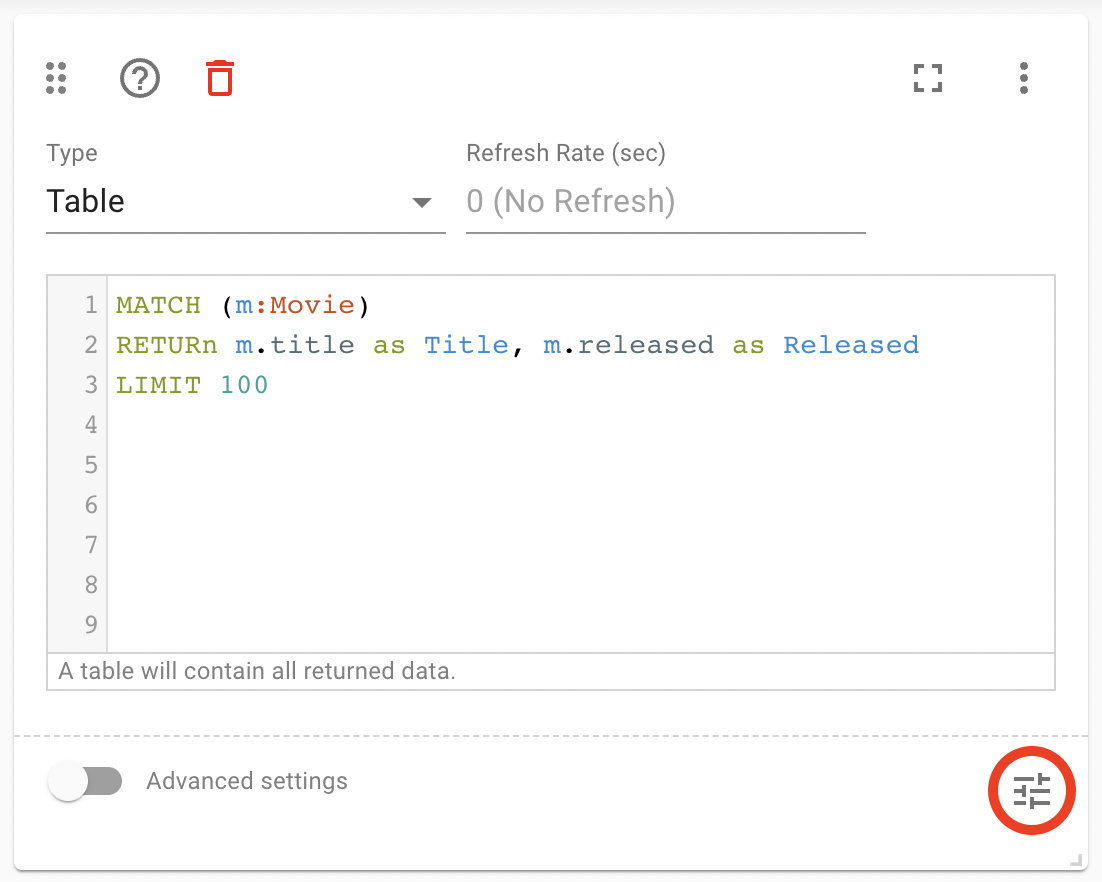
Then, on several report types, rule-based styling can be applied to the visualization. To do this, open up the report settings, Then, click the Rule-Based Styling button on the bottom right (marked with the red circle):
This will open up the action definition window. Inside this screen, a list of action rules can be defined. Each rule will have the following structure:
IF [CONDITION] THEN [STYLE]
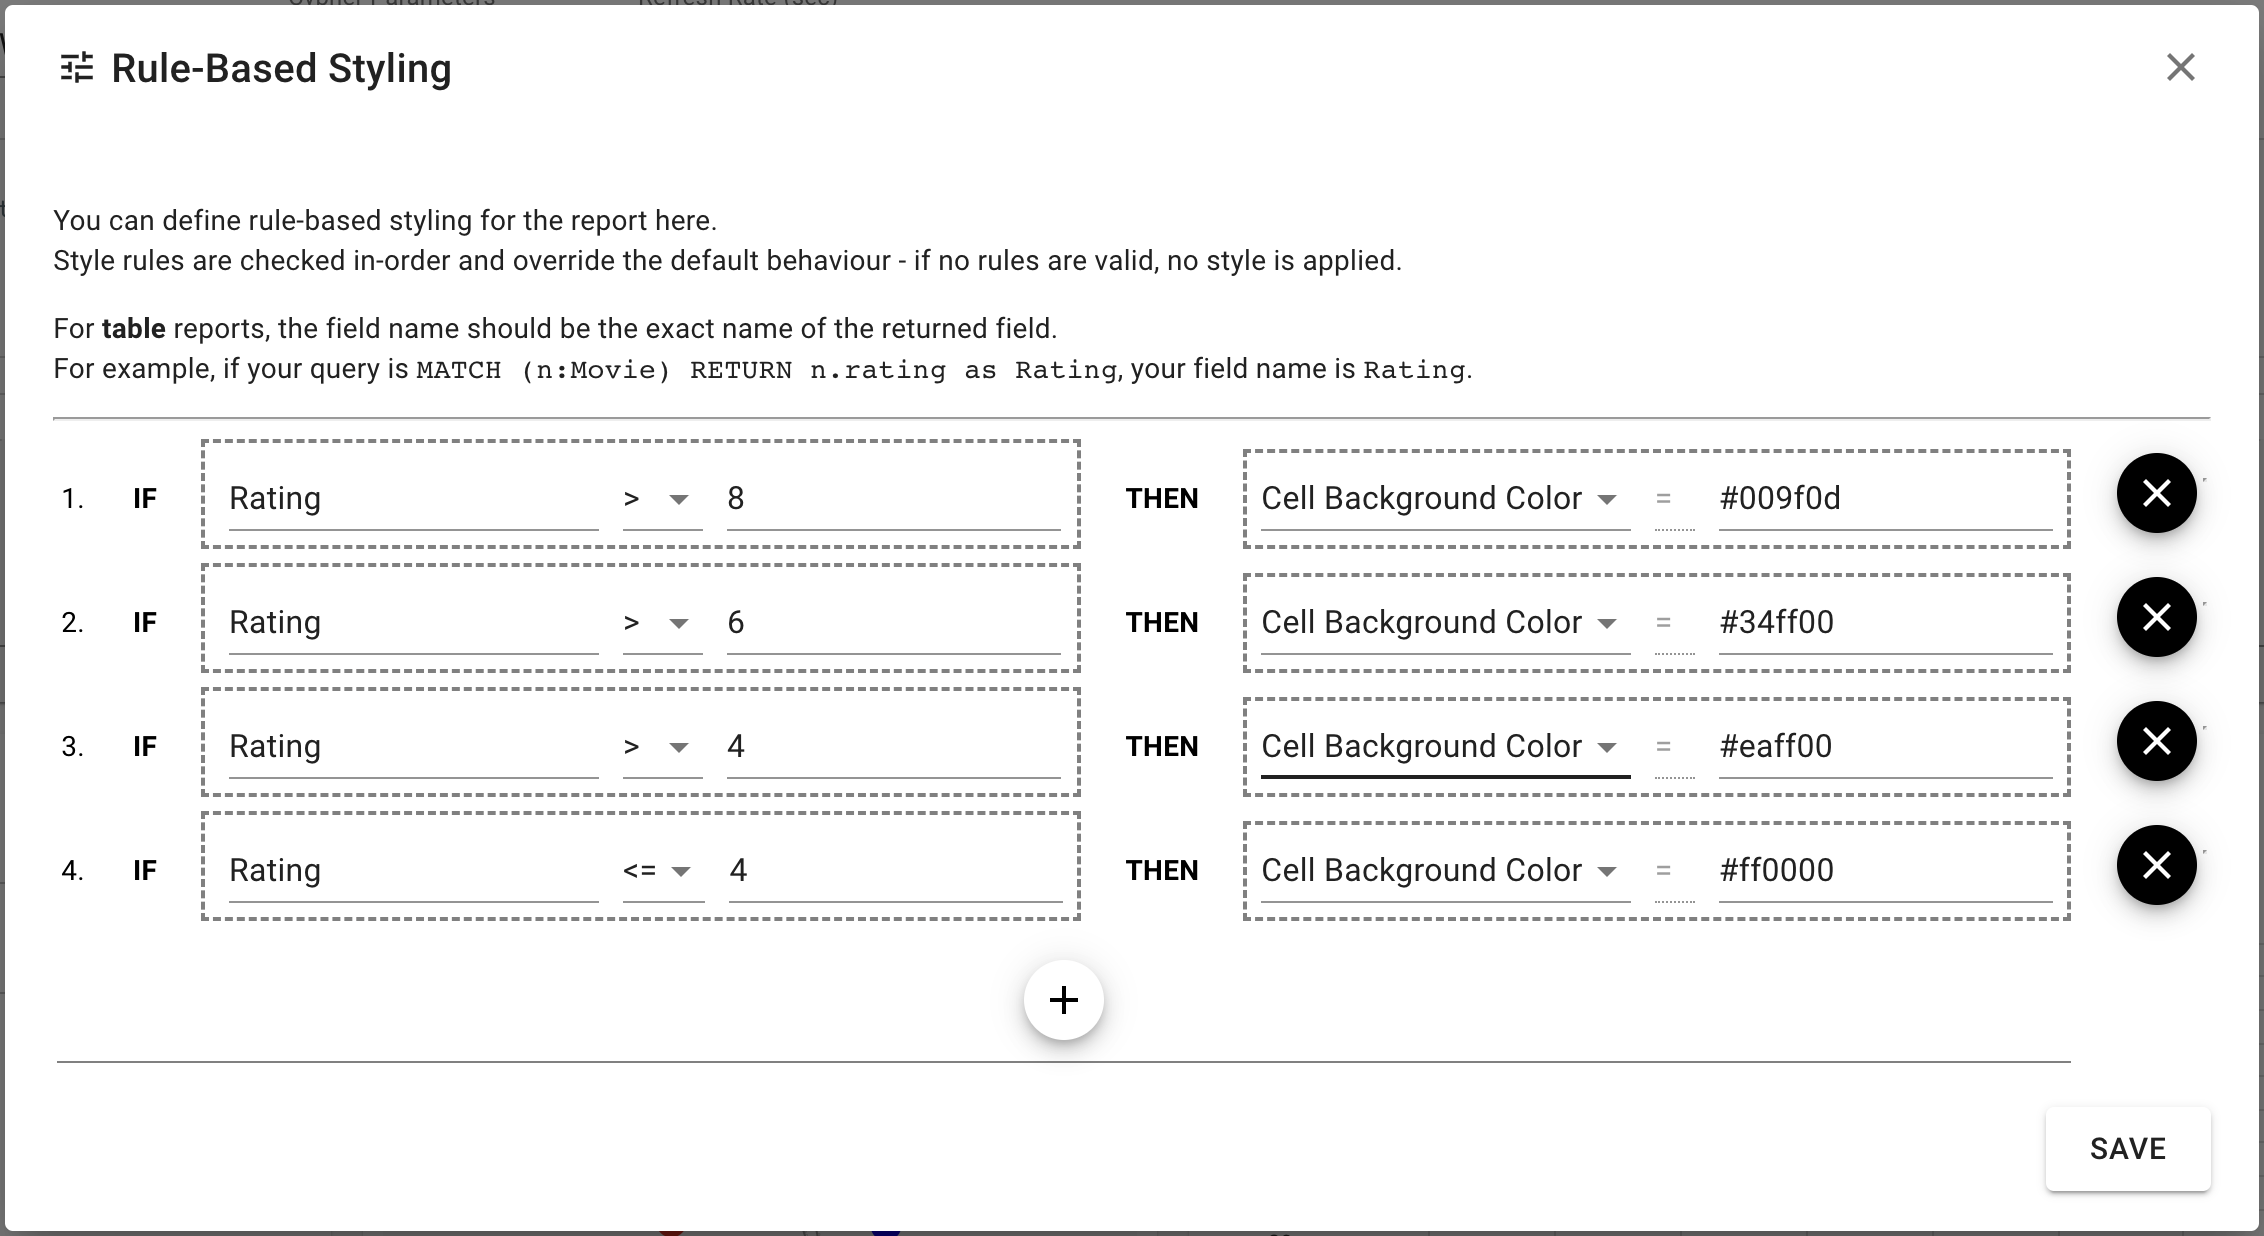
Conditions are always based on one of the return fields of the query. This can be a simple field (text, number) or a node property. Style rules are (as of NeoDash 2.1) always color-based.
For example, the following rule will set the color of all Warning
nodes to red:
IF Warning.level = "critical" THEN 'Node Color' = "red"
Ultimately, it is important to understand that the order of the rules is important. If a node matches multiple rules, the first rule that matches will be used. If no rules are matched, the default style will be used.