Graph
The graph report will render all returned nodes, relationships and paths in a force-directed graph layout. This includes collections (lists) of these objects.
The library react-force-graph is used to create the visualizations.
Depending on your browser, the visualization should be able to handle
drawing 1000-3000 nodes/relationships with custom styling options.
The graph layout contains an extensive set of features, including:
-
Drag and drop nodes.
-
Custom node/relationship styling.
-
Tooltips/inspect window on nodes/relationships.
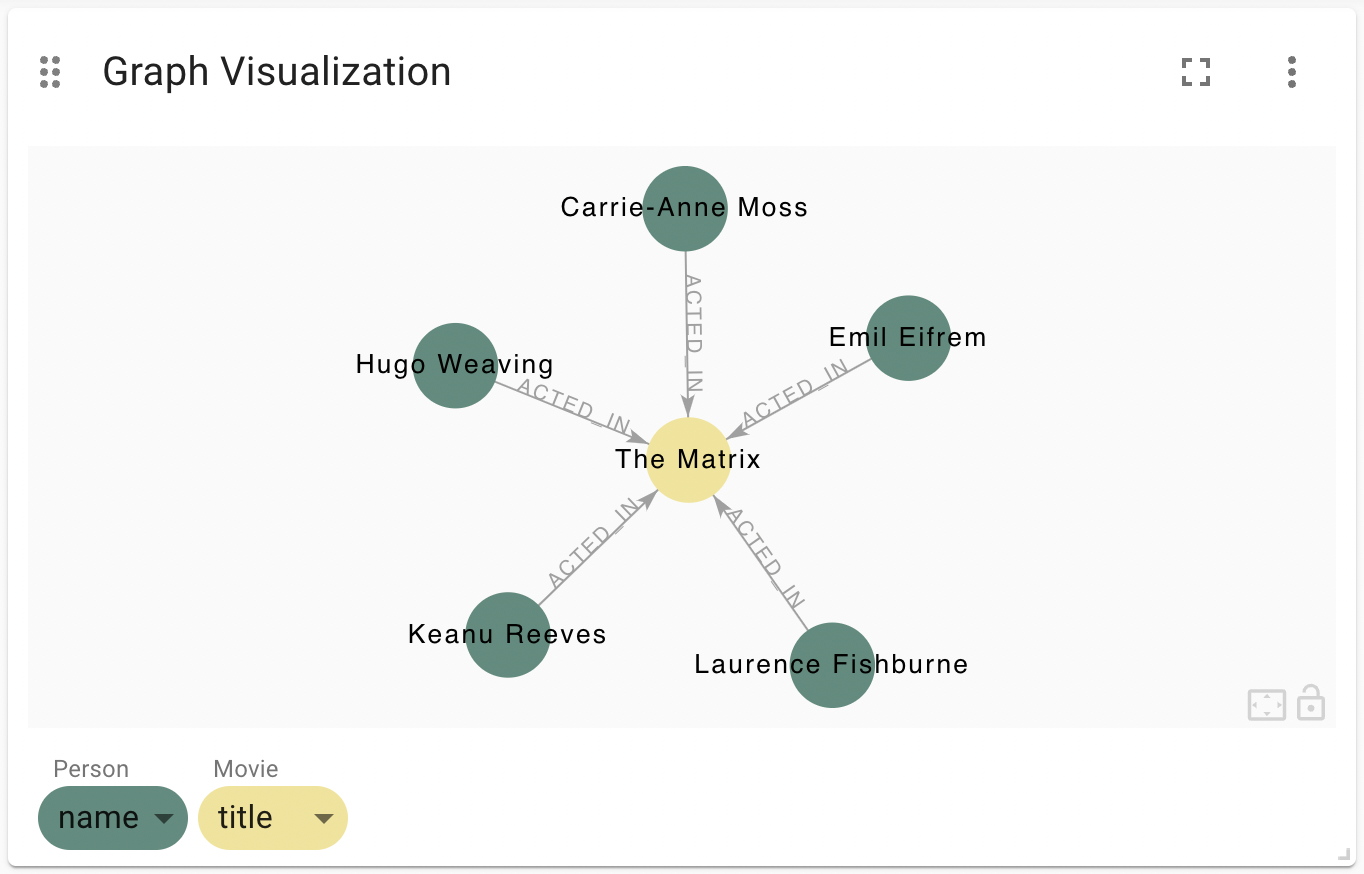
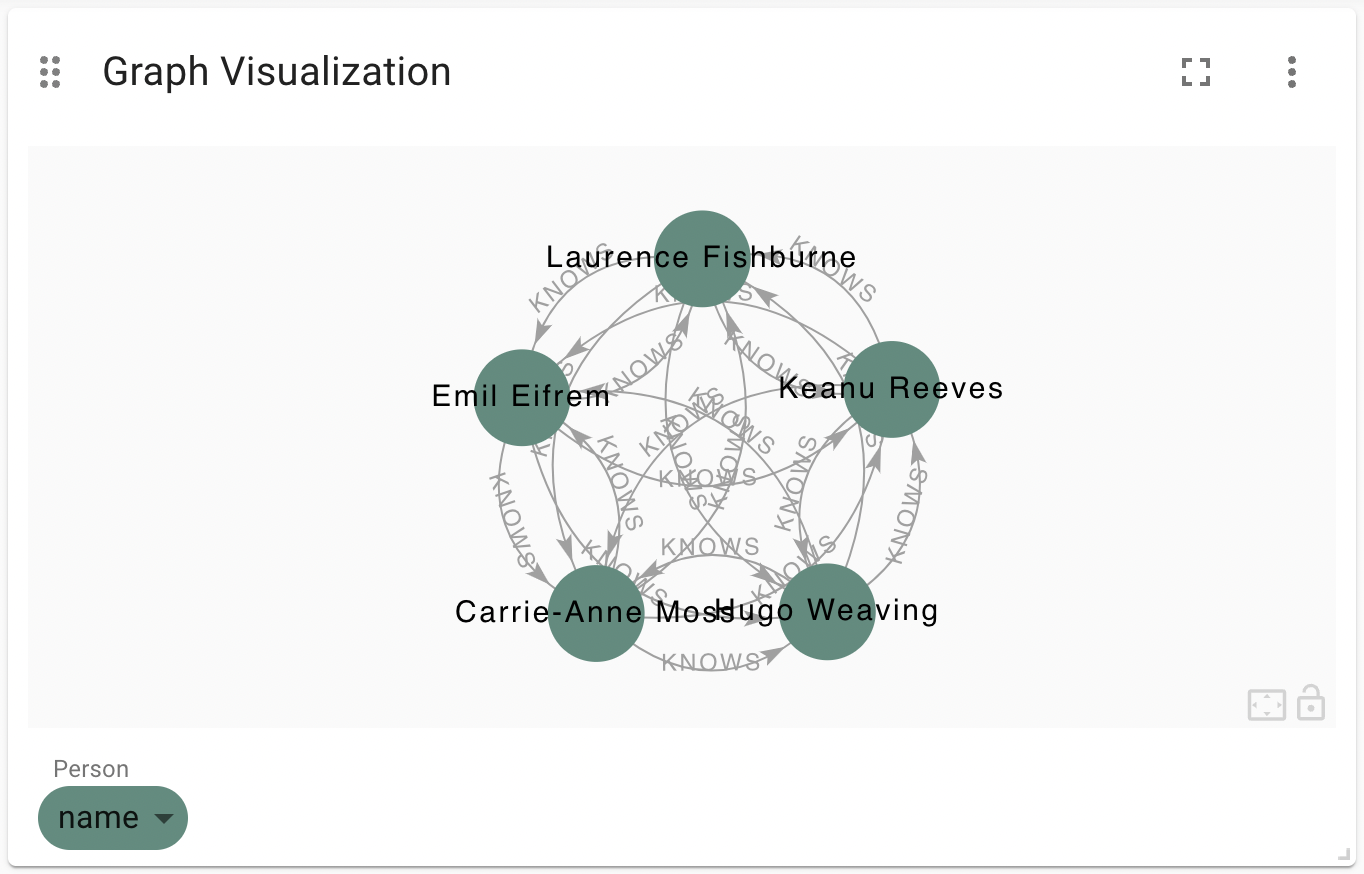
Virtual Graph (apoc is required)
MATCH (p:Person)-[:ACTED_IN]->(m:Movie)<-[:ACTED_IN]-(p2:Person)
WHERE m.title = "The Matrix"
RETURN p, p2, apoc.create.vRelationship(p, "KNOWS", {}, p2)
Advanced Settings
| Name | Type | Default Value | Description |
|---|---|---|---|
Node Color Scheme |
List |
neodash |
The color scheme to use for the node labels. Colors are assigned automatically (consequitevely) to the different labels returned by the Cypher query. |
Node Label Color |
Text |
black |
The color of the labels drawn on the nodes. |
Node Label Font Size |
Number |
3.5 |
Size of the labels drawn on the nodes. |
Node Size |
Number |
2 |
Default size of a node in the graph visualization. This size is applied if no custom size styling is defined and no Rule-Based styling is active. |
Node Size Property |
Text |
size |
Optionally, the name of the node property to map to the node size. This lets you define sizes on a node-specific level, if you have a property that directly maps to the numeric size value. |
Node Color Property |
Text |
color |
Optionally, the name of the node property to map to the node color. This lets you define colors on a node-specific level, if you have a property that directly maps to the HTML color value. |
Relationship Color |
Text |
#a0a0a0 |
The color used for drawing the relationship arrows in the visualization. |
Relationship Width |
Text |
1 |
The (default) width of the relationship arrows in the visualization. |
Relationship Label Color |
Text |
#a0a0a0 |
The color of the labels (relationship type) drawn next to the relationship arrows. |
Relationship Label Font Size |
Text |
2.75 |
The font size of the labels (relationship type) drawn next to the relationship arrows. |
Relationship Color Property |
Text |
color |
Optionally, the name of the relationship property to map to the arrow color. This lets you define colors on a relationship-specific level, if you have a property that directly maps to the HTML color value. |
Relationship Width Property |
Text |
width |
Optionally, the name of the relationship property to map to the arrow width. This lets you define widths on a relationship-specific level, if you have a property that directly maps to the width value. |
Animated Particles on Relationships |
on/off |
off |
If enabled, draw relationships with animated particles on them, moving in the direction of the relationship. |
Arrow head size |
Number |
3 |
Use this to set the length of the arrow head, size is adjusted automatically. If 0, no arrow will be drawn. |
Background Color |
Text |
#fafafa |
The background color of the visualization. |
Layout (experimental) |
List |
force-directed |
Use this to switch from the main (force-directed) layout to one of the two experimental layouts (tree/radial). For the experimental layouts, make sure your graph is a DAG (directed acyclic graph). |
Enable graph exploration |
on/off |
on |
Enables basic exploration functionality for the graph. Exploration can be done by right clicking on a node, and choosing 'Expand' to choose a type to traverse. Data is retrieved real-time and not cached in the visualization. |
Enable graph editing |
on/off |
off |
Enables editing of nodes and relationships in the graph from the right-click context menu. In addition, lets users create new relationships with existing types/property keys as present in the database. |
Show pop-up on Hover |
on/off |
on |
if enabled, shows a pop-up when a user hovers over one of the nodes/relationships in the visualization. The pop-up contains the label and properties of the node/relationship. |
Show properties on Click |
on/off |
on |
if enabled, opens up a window when a user clicks on one of the nodes/relationships in the visualization. The window contains the label and properties of the node/relationship. |
Fix node positions after drag |
on/off |
on |
If enabled, locks in (freezes) the node positions after a user drags them. |
Drilldown Link |
Text (URL) |
(no value) |
Specifying a URL here will display a floating button on the top right of the visualization. This button can be used to drilldown into a different tool (e.g. Bloom) so that the graph can be explored further. Dynamic Dashboard Parameters (e.g. $neodash_person_name) can be used in these links as well. |
Hide Selections |
on/off |
off |
If enabled, hides the property selector (footer of the visualization). |
Auto-run query |
on/off |
on |
when activated automatically runs the query when the report is displayed. When set to `off', the query is displayed and will need to be executed manually. |
Report Description |
markdown text |
When specified, adds another button the report header that opens a pop-up. This pop-up contains the rendered markdown from this setting. |
Rule-Based Styling
Using the Rule-Based Styling menu, the following style rules can be applied to the graph:
-
The background color of a node.
-
The label color of a node.