Pie Chart
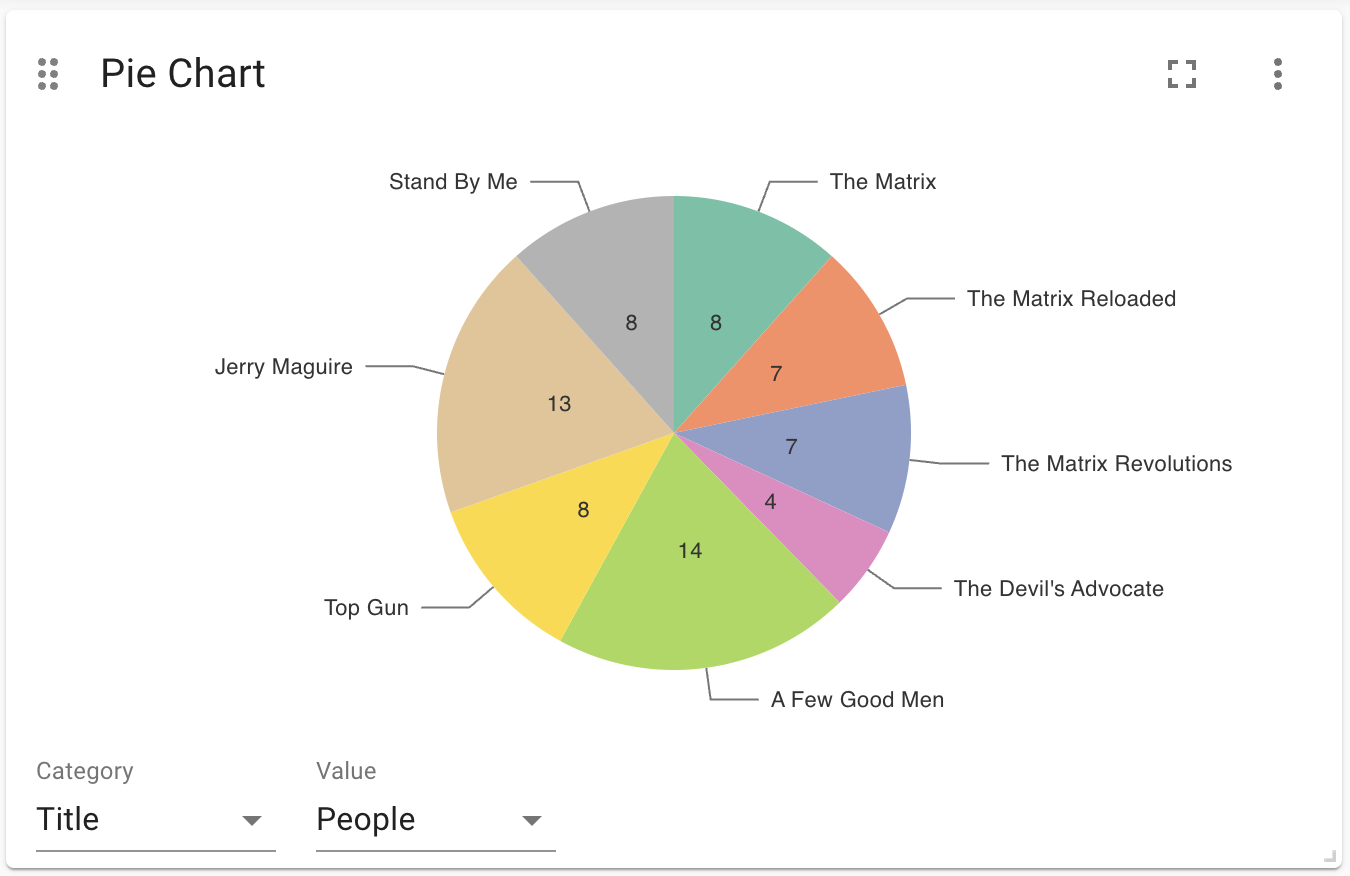
A pie chart will draw categories and values in a circular disc layout. The pie chart will require you to choose the following selections:
-
Category: a text field. These will be the labels on the pie slices.
-
Value: a numeric field. This will be the size of the slices.
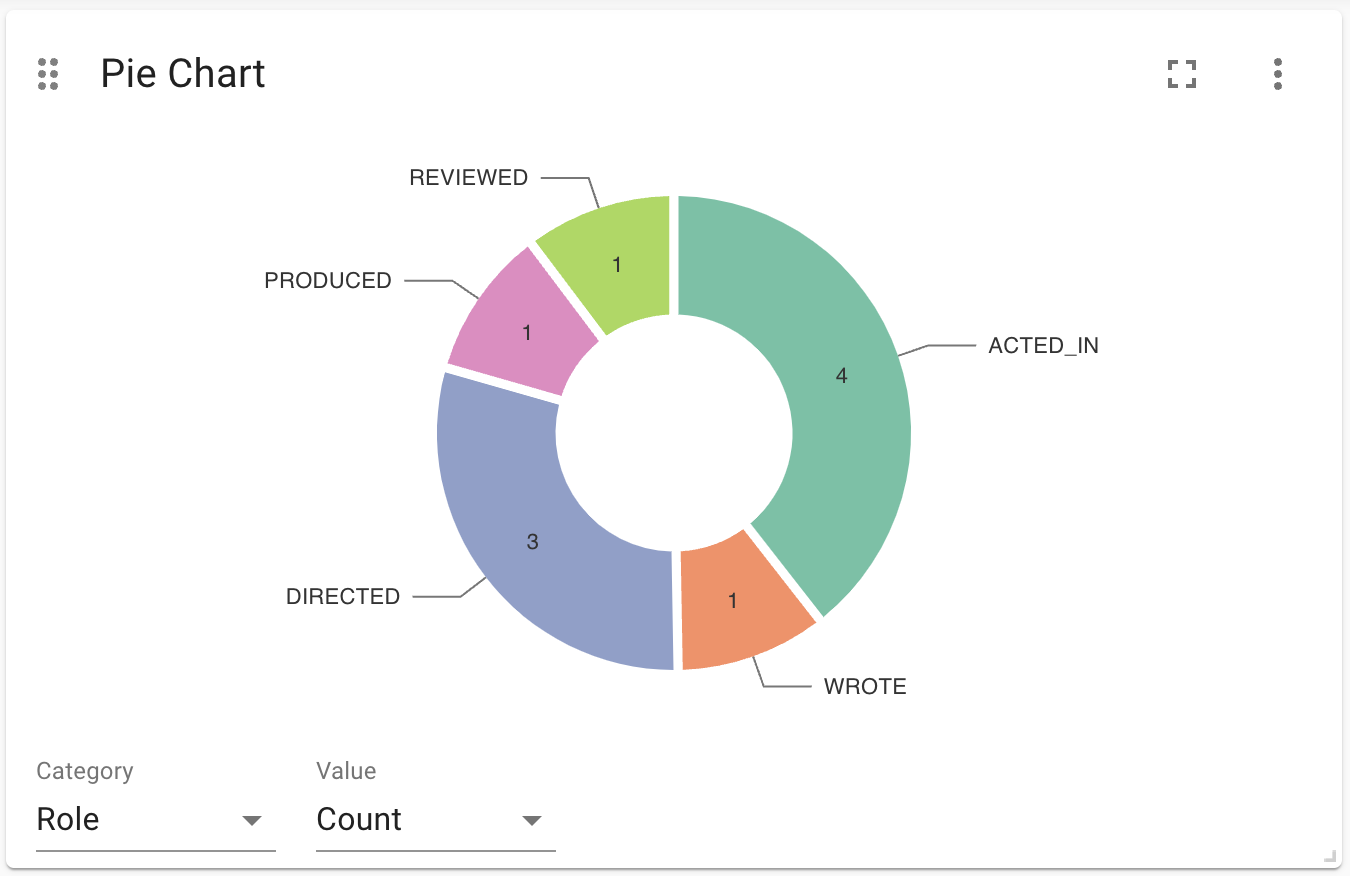
The pie chart can be additionally be customized to become a donut chart, show categories as a legend, and to show the percentage of the total value of the pie. See Advanced Settings for more information.
Advanced Settings
| Name | Type | Default Value | Description |
|---|---|---|---|
Show Legend |
on/off |
off |
If enabled, shows a legend on the bottom of the visualization. |
Auto-sort slices by value |
on/off |
off |
If enabled, automatically sorts the pie slices in order of size. |
Show Values in Slices |
on/off |
off |
If enabled, show the category values inside the pie slices. |
Show categories next to Slices |
on/off |
off |
If enabled, show the category values next to the pie slices. |
Enable interactivity |
on/off |
on |
If enabled, turn on animations when a user hovers over a pie slice. |
Color Scheme |
List |
The color scheme to use for the slices. Colors are assigned automatically (consequitevely) to the different categories returned by the Cypher query. |
|
Pie inner radius |
Number |
0 |
The radius of the ``donut hole'' inside the pie. When set to zero, no hole is present, when set to 0.99, the pie will be almost completely visualized as a thin disc. |
Slice padding angle (degrees) |
number |
0 |
the angle between each pie slice reserved for white space. For example, when set to 3.6, there will be 1/100th of the total circle space reserved between each slice. |
Slice border with (px) |
number |
0 |
The width of the border of each slice. |
Margin Left (px) |
number |
50 |
The margin in pixels on the left side of the visualization. |
Margin Right (px) |
number |
24 |
The margin in pixels on the right side of the visualization. |
Margin Top (px) |
number |
24 |
The margin in pixels on the top side of the visualization. |
Margin Bottom (px) |
number |
40 |
The margin in pixels on the bottom side of the visualization. |
Hide Selections |
on/off |
off |
If enabled, hides the property selector (footer of the visualization). |
Auto-run query |
on/off |
on |
when activated automatically runs the query when the report is displayed. When set to `off', the query is displayed and will need to be executed manually. |
Report Description |
markdown text |
When specified, adds another button the report header that opens a pop-up. This pop-up contains the rendered markdown from this setting. |
Rule-Based Styling
Using the Rule-Based Styling menu, the following style rules can be applied to the pie chart:
-
The background color of a pie slice.