Bar Chart
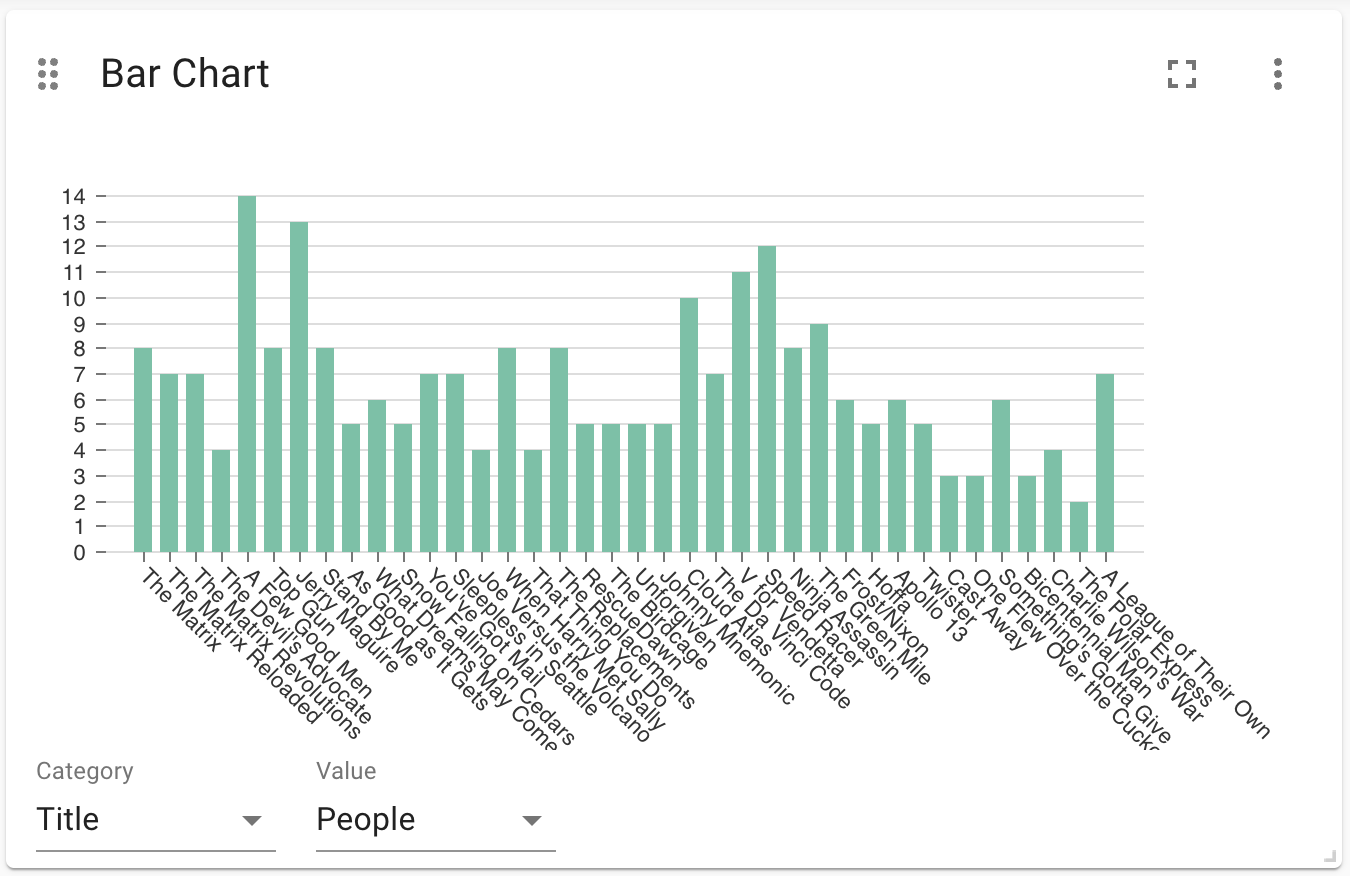
A bar chart will draw categories and values in a familiar bar-layout. The bar chart will require you to choose the following selections:
-
Category: a text field. These will be the labels on the bars.
-
Value: a numeric field. This will be the height of the bars.
-
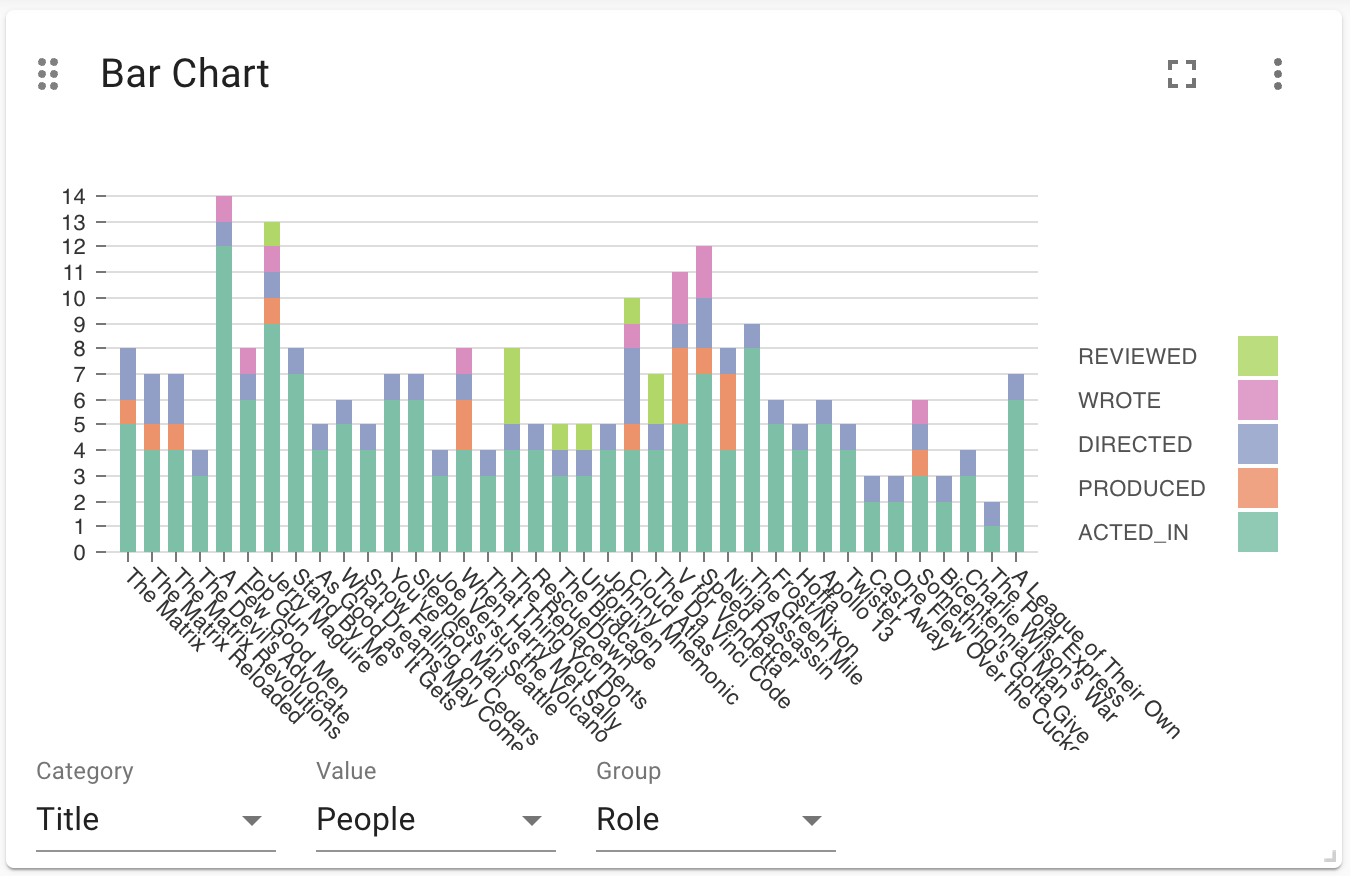
Group: Optionally, a second textual field. When ``Grouping'' is enabled in the advanced settings, the group can be used to draw a stacked bar chart, with several groups per category.
Advanced Settings
| Name | Type | Default Value | Description |
|---|---|---|---|
Show Legend |
on/off |
off |
If enabled, shows a legend at the top right of the visualization. |
Grouping |
on/off |
off |
If enabled, lets users specify a third, grouping field. This is used to distinguish between different groups in the stacked bar chart. |
Value Scale |
List |
linear |
When set to symlog, uses a Symmetric logarithmic scale instead of the default linear scale. |
Min Value |
Number |
auto |
If not set to ``auto'', this variable is minimum value for the bar chart. |
Max Value |
Number |
auto |
If not set to ``auto'', this variable is the maximum value for the bar chart. |
Group Mode |
List |
stacked |
This setting determines how different groups are visualized when grouping is enabled. If set to stacked, different groups of the same category are stacked on top of each other. If set to grouped, they are placed alongside each other. |
Layout |
List |
vertical |
Whether to use a vertical or horizontal bar chart layout. |
Color Scheme |
List |
The color scheme to use for the category groups. Colors are assigned automatically (consequitevely) to the different groups returned by the Cypher query. |
|
Show Values on Bars |
on/off |
off |
If enabled, shows the category value inside the respective bar. |
Skip label on width (px) |
number |
0 |
Skip label if bar width is lower than provided value, ignored if 0. |
Skip label on height (px) |
number |
0 |
Skip label if bar height is lower than provided value, ignored if 0. |
Custom label position |
off/top/bottom |
off |
Allow user to place label out of the bar. This will override any other label configuration. |
Label Rotation (degrees) |
number |
45 |
the angle at which the bar labels are rotated. |
Margin Left (px) |
number |
50 |
The margin in pixels on the left side of the visualization. |
Margin Right (px) |
number |
24 |
The margin in pixels on the right side of the visualization. |
Margin Top (px) |
number |
24 |
The margin in pixels on the top side of the visualization. |
Margin Bottom (px) |
number |
40 |
The margin in pixels on the bottom side of the visualization. |
Legend Width (px) |
number |
128 |
The width in pixels of each legend label on top of the visualization (if enabled). |
Hide Selections |
on/off |
off |
If enabled, hides the property selector (footer of the visualization). |
Auto-run query |
on/off |
on |
when activated automatically runs the query when the report is displayed. When set to `off', the query is displayed and will need to be executed manually. |
Report Description |
markdown text |
When specified, adds another button the report header that opens a pop-up. This pop-up contains the rendered markdown from this setting. |
Rule-Based Styling
Using the Rule-Based Styling menu, the following style rules can be applied to the bar chart:
-
The color of the bar.