Featured Post

Forrester Wave: GraphRAG is a Game-Changer for GenAI Accuracy and Relevance
Oct 30 3 mins read
We’re thrilled to share that Forrester has recognized Neo4j as a Strong Performer in The Forrester Wave™: Vector Databases, Q3 2024. “We haven’t witnessed this level of excitement in the database landscape in decades,” Forrester notes, explaining that databases with integrated... read more

Connecting the Dots in Early Drug Discovery at Novartis
Jun 20, 2018 20 mins read
Editor’s Note: This presentation was given by Stephan Reiling at GraphConnect San Francisco in October 2016. Presentation Summary In this talk, Senior Scientist Stephan Reiling describes some of the ways that a major pharmaceutical company conducts the search for medical compounds, and the... read more

The ROI on Connected Data:
Extract More Value from Existing Data Using Graphs [+ Telia Case Study]
Jun 18, 2018 6 mins read
From LinkedIn to Facebook to Google, top companies are driving their businesses using graphs. And use cases span industries as well. What those new to graph technology may not understand is that creating a graph does not require starting from scratch. Existing data stores, such as data lakes and... read more

This Week in Neo4j – Neo4j ETL Tool Tutorial, Release of JDBC Driver, Neo4j on AWS Marketplace
Jun 16, 2018 6 mins read
Welcome to this week in Neo4j where we round up what’s been happening in the world of graph databases in the last 7 days. This week we have a tutorial of the Neo4j ETL Tool, a React.js application that uses the new temporal and geospatial data types, a new release of the JDBC Driver,... read more

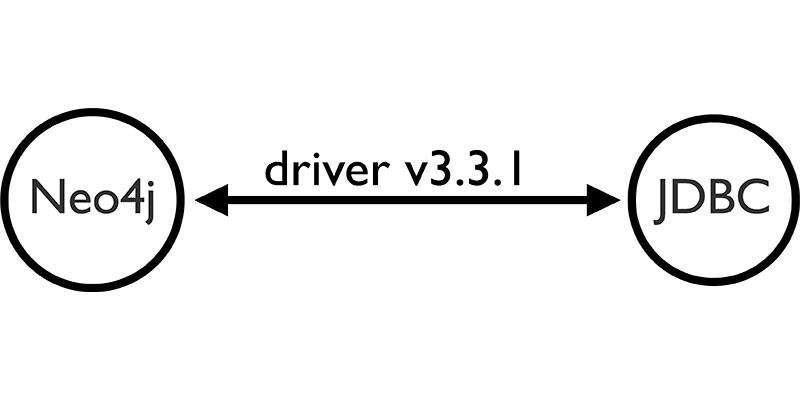
The Neo4j JDBC Driver 3.3.1 Release Is Here [+ Examples]
Jun 14, 2018 5 mins read
Our team at LARUS has been quite busy since the last JDBC driver release. Today, we're happy to announce the 3.3.1 release of the Neo4j-JDBC driver. The release has been upgraded to work with recent Neo4j 3.3.x versions and Bolt driver 1.4.6. (Work on Neo4j 3.4.x and drivers 1.6.x is in... read more

Using Neo4j to Investigate Connections in the U.S. Healthcare System
Jun 13, 2018 6 mins read
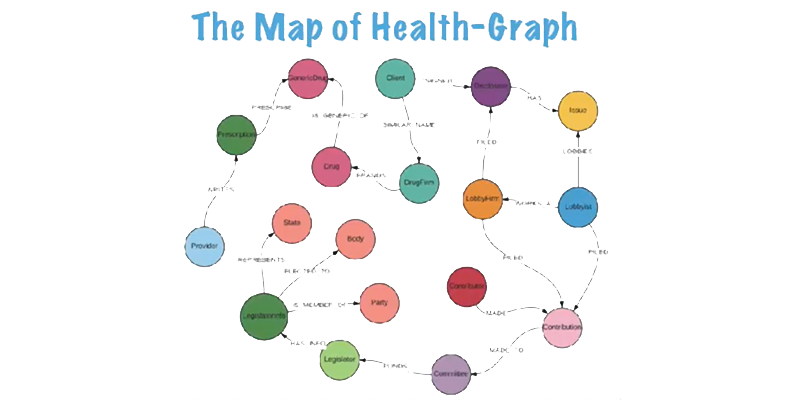
Editor’s Note: This presentation was given by Yaqi Shi at GraphConnect San Francisco in 2016. Presentation Summary In this presentation, Yaqi Shi describes the process of developing Health-Graph, a model of how some of the key elements in the healthcare system are connected. With a... read more

The ROI on Connected Data:
The Overlooked Value of Context for Business Insights [+ Airbnb Case Study]
Jun 11, 2018 4 mins read
Your data is inherently valuable, but until you connect it, that value is largely hidden. Those data relationships give your applications an integrated view that powers real-time, higher-order insights traditional technology cannot deliver. In this series, we'll examine how investments in... read more