Featured Post

Forrester Wave: GraphRAG is a Game-Changer for GenAI Accuracy and Relevance
Oct 30 3 mins read
We’re thrilled to share that Neo4j was recognized as a Strong Performer in The Forrester Wave™: Vector Databases, Q3 2024. “We haven’t witnessed this level of excitement in the database landscape in decades,” the Forrester report notes, explaining that databases with integrated... read more

This Week in Neo4j – Health Care & Life Sciences Workshop, Cloudflare Workers, Apache Hop, and More
Nov 20, 2021 6 mins read
Hello, everyone! It’s that time again to explore the latest news in this week's edition of This Week in Neo4j. This week, we feature the Neo4j Health Care & Life Sciences Workshop 2021, a two-day workshop with in-depth technical presentations from the healthcare and life... read more

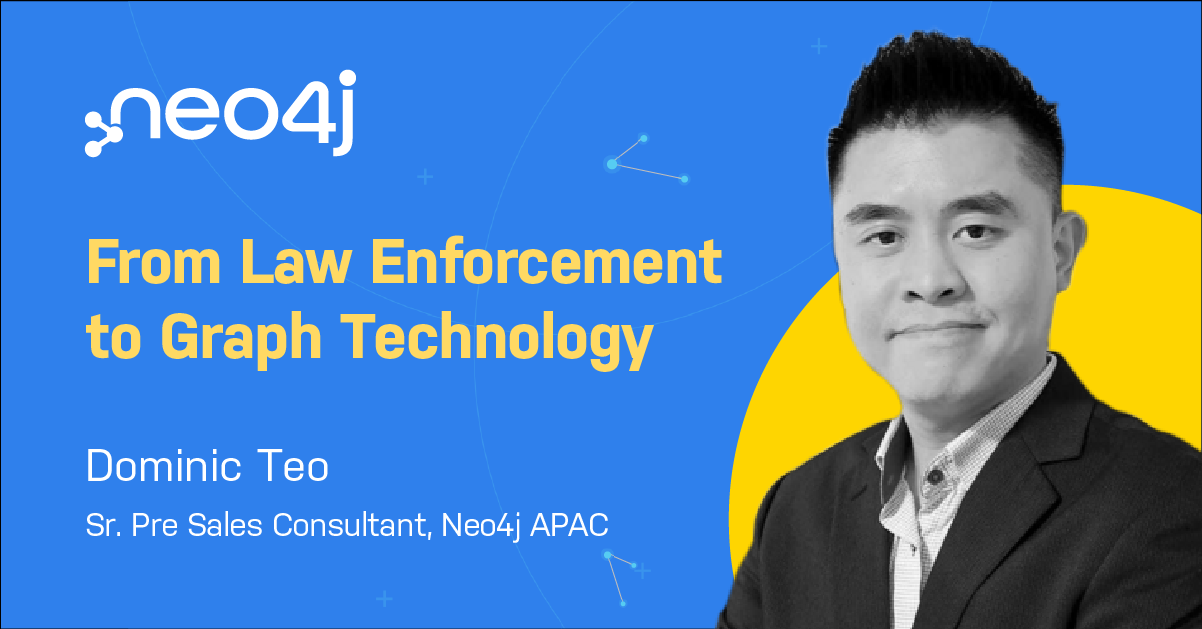
From Law Enforcement to Graph Technology: An Unlikely Relationship
Nov 18, 2021 3 mins read
After spending 14 years in data technology and most recently working in law enforcement for Interpol out of Singapore, I was drawn (again) into the realm of connected data and decided to take the leap of "Graith" (Graph + Faith). So Why Did I Join Neo4j? It was a timely opportunity,... read more

From Graph to Knowledge Graph: Actioning vs. Decisioning Knowledge Graphs
Nov 17, 2021 4 mins read
Unleashing the power of knowledge is imperative for enterprises looking for a competitive edge. Everyone wants to capture knowledge, to connect everything that they know. However, turning data into knowledge is still very much an ongoing effort – though progress has been made, most data... read more

This Week in Neo4j – Big Announcements, Rugby Stats, Social Graphs, and Mergers & Acquisitions
Nov 13, 2021 6 mins read
Hello, everyone! It’s week two of four for my run publishing TWIN4J. Last week in the UK we enjoyed Bonfire Night, a night that I have found makes absolutely no sense outside of the UK. On 5 November 1605, a man named Guy Fawkes was arrested while guarding explosives beneath... read more

You Don’t Need a Crystal Ball When You Have Graph Data Science
Nov 12, 2021 3 mins read
Crystal balls, tarot cards, fortune tellers, Groundhog Day – all things used to make predictions. The problem is, they’re not very reliable. But you know what is reliable? Graph data science. Graph data science is a science-driven approach to gain knowledge from the relationships and... read more

Revealing the Life of a Twitter Troll with Visual Timeline Analytics
Nov 10, 2021 4 mins read
Editor's note: This presentation was given by Katerina Baousi at NODES 2021. Don't you ever wonder what the daily life of a Twitter troll looks like? Using Neo4j, I was able to build an application that reveals it. I'm going to introduce you to a different way to visualize your graphs, going... read more