Getting started
The Python Graph Visualization library allows you to visualize graph data interactively in Python.
The library wraps the JavaScript-based Neo4j Visualization Library (NVL) and adds convenience methods to import data from sources such as:
Installation
You can install the latest version of the library with pip:
pip install neo4j-vizOptional dependencies
There are a few optional dependencies that you can install to enable additional features of the library. The tutorials install any additional dependencies they need in their first notebook cells, so there is nothing extra to install to follow along.
Integration with external sources
The library can import data directly from external sources. Each integration page includes installation instructions for the needed dependencies.
Creating your first visualization
In this section, we will cover the very basics of creating a visualization graph using the neo4j-viz library.
We will use a small toy graph representing the purchase history of a few people and products.
We start by instantiating the Nodes and Relationships we want in our graph. The only mandatory fields for a node are the “id”, and “source” and “target” for a relationship. But the other fields can optionally be used to customize the appearance of the nodes and relationships in the visualization.
Lastly we create a VisualizationGraph object with the nodes and relationships we created, and call its render_widget method to display the graph as an interactive widget.
from neo4j_viz import Node, Relationship, VisualizationGraph

nodes = [
    Node(id=0, size=10, caption="Person"),
    Node(id=1, size=10, caption="Product"),
    Node(id=2, size=20, caption="Product"),
    Node(id=3, size=10, caption="Person"),
    Node(id=4, size=10, caption="Product"),
]

relationships = [
    Relationship(
        source=0,
        target=1,
        caption="BUYS",
    ),
    Relationship(
        source=0,
        target=2,
        caption="BUYS",
    ),
    Relationship(
        source=3,
        target=2,
        caption="BUYS",
    ),
]

VG = VisualizationGraph(nodes=nodes, relationships=relationships)

VG.render_widget(initial_zoom=2)|
See the Getting started tutorial to interact with the graph. |
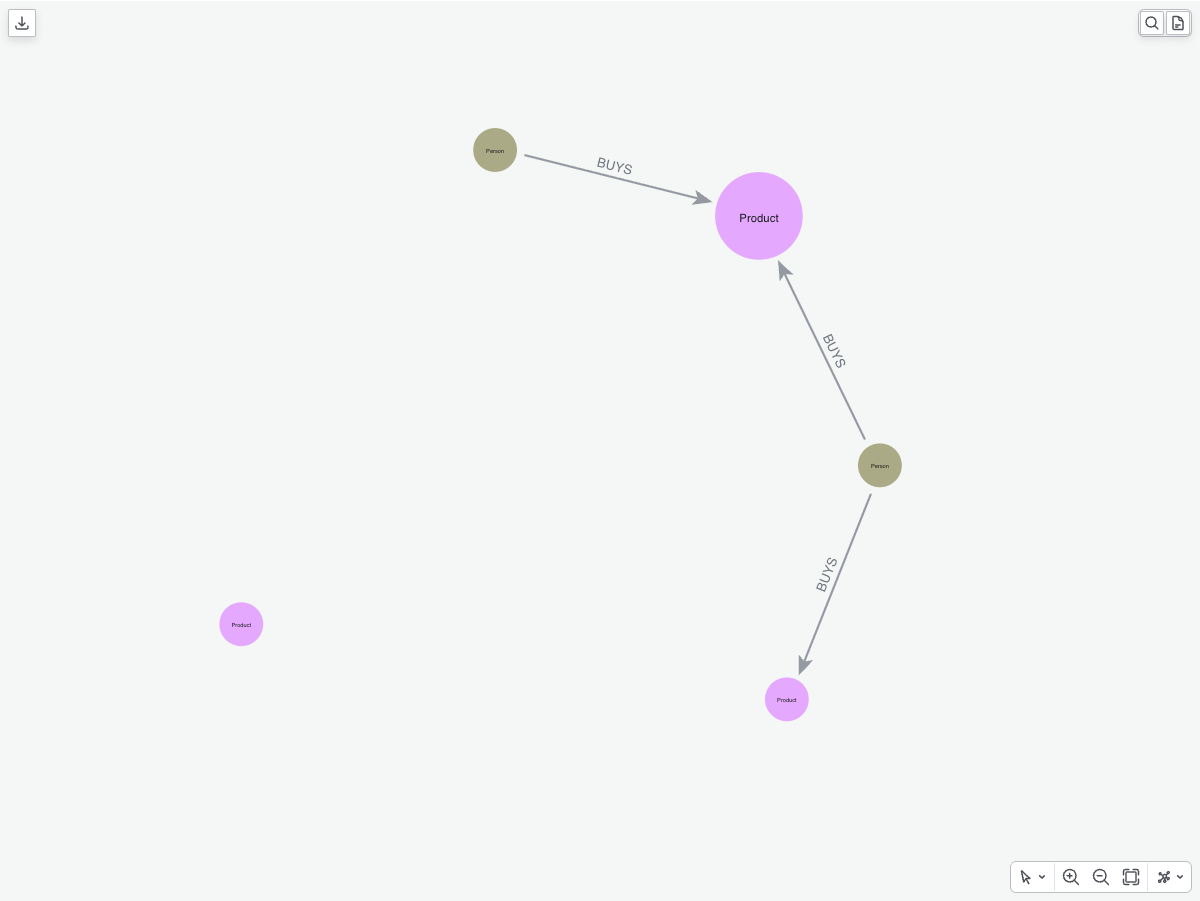
render_widget is the recommended way to display a graph: it returns an interactive widget with two-way sync between Python and the browser, and features such as adding data to a graph that is already displayed, changing the layout or zoom dynamically, and reacting to selections and clicks are only available through it.
The render method instead returns a static HTML object and is not recommended for interactive use; see Rendering a graph for the full list of options.
|
As we can see in the graph above, the radius of one of the nodes is larger than the others. This is because we set the “size” field of the node to 20, while the others are set to 10.
At this time the nodes are colored using the default colors.
If we want to distinguish between the different types of nodes, we can color them differently with the color_nodes method.
We can pass the field we want to use to color the nodes as an argument.
In this case, we will use the "caption" field.
Nodes with the same "caption" will have the same color.
We will use the default color scheme, which is the Neo4j color scheme.
VG.color_nodes(field="caption")

VG.render_widget(initial_zoom=2)|
See the Getting started tutorial to interact with the graph. |
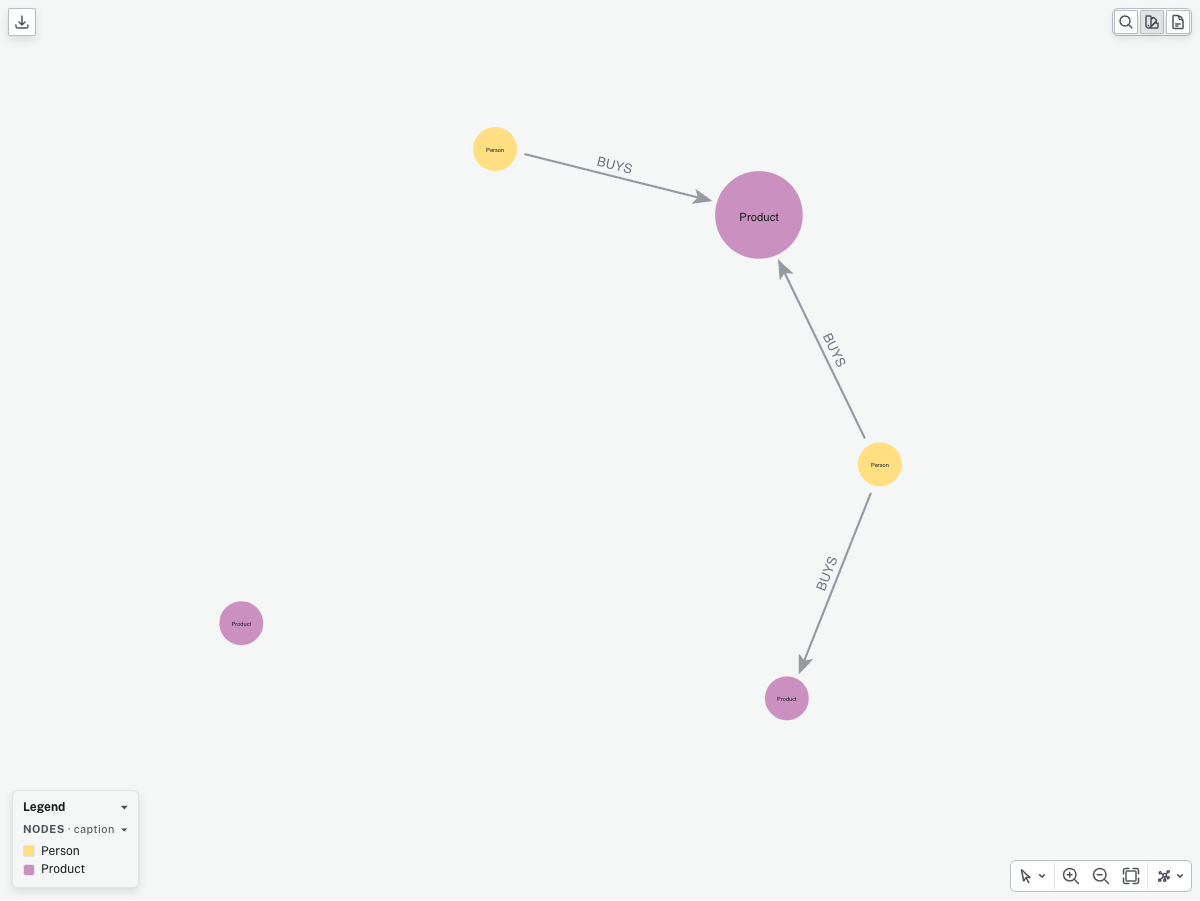
We are now easily able to distinguish between the different types of nodes in the graph.
Next steps
Now that we have covered the basics of creating and rendering a visualization graph, we can move on to more advanced topics.
Here are some suggestions for what to do next:
-
Browse the tutorials for more examples and use cases
-
Learn about the integrations with other libraries such as Neo4j GDS and Pandas
-
Check out the rendering options and convenience methods of
VisualizationGraph -
Read about our API reference