Actions
An action is event-driven. When an action trigger within a visualization is clicked, it assigns a value to a parameter. Any card with a Cypher query that includes that parameter responds immediately, so visualizations update dynamically based on the selection.
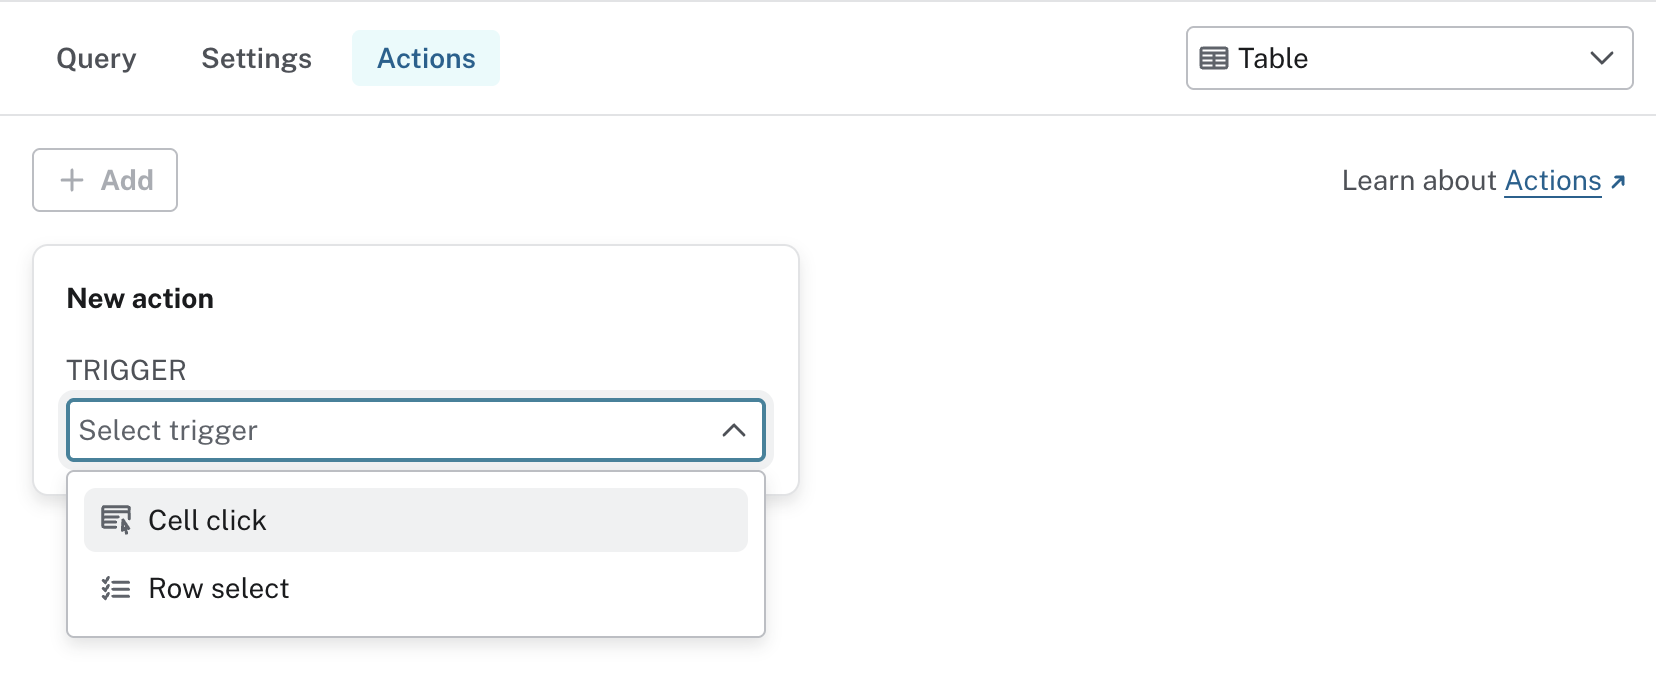
There are two types of actions, used with tables:
-
Cell click action - Triggered when a person clicks a specific cell value.
-
Row select action - Triggered when a person selects one or more rows.
Use cases:
-
Click a person’s name → filters other charts with their data
-
Click a cell → navigates to another dashboard page with context applied, allowing drill-down into the data
-
Select multiple rows of orders → another card calculates total order weight
For many use cases, especially proof-of-concepts, this level of interactivity significantly expands what dashboards can do. This enables rapid prototyping, with your dashboard behaving like an app.
Instead of building a graph app with frontend code, sketch one directly in your dashboard.