Modeling Designs
|
Important - page not maintained
This page is no longer being maintained and its content may be out of date. For the latest guidance, please visit the Getting Started Manual . |
In this section, you will learn how to represent graph data using a variety of modeling decisions. How you construct your data model can impact your queries and performance. Our goal is to show you how to evaluate your model and make appropriate changes, so you can define the best solution for your use case and maximize the performance of your queries.
You should understand what a graph database is and know the components of the property graph data model
Beginner
Why the Data Model Makes a Difference
As with any database, the data model that you design is important in determining the logic your queries and the structure of data in storage. This practice extends to graph databases, with one exception. Neo4j is schema-free, which means that your data model can adapt and change easily with your business.
Need to start collecting a new field and capture new analysis? Or need to change the way you interpret a customer or other entity and modify its definition? Or regulation requires systems to capture less information or restrict readability (change data format/types)?
You may have worked for a company where each area or department defines a domain differently. Take, for instance, a generic customer domain. To different areas within the business, a customer can be defined as different types of individuals. These definitions may also change over time or the company may decide to unify the meaning of a customer across departments.
If you have worked with other types of databases, you will already be familiar with the development and administrative work that any of these scenarios entail. However, Neo4j allows you to effortlessly adjust detailed and broad changes across pieces or the entirety of the graph. Whether it is small changes over time or a broad definition that includes a variety of needed information about your entities, the database is able to handle it. It is simply up to the developers and architects to determine the structure of the data model and how to define entities for queries.
In the next few paragraphs, we will introduce a few different ways to look at different data sets and show how each impacts queries and performance for traversing graph data.
Property vs Relationship
One of the earliest decisions you may encounter is whether to model something as a property on a node or as a relationship to a separate node.
Take, for example, the data below modeling a movie genre as a property on the Movie node.

To write a query finding the genre(s) of a particular movie is very simple.
It would find the Movie node it wants to know about, then return the values listed in the genre property.
However, to find out which movies share genres, you would need a much more complex query to find each Movie node, loop through each of the genres in the property array, and compare with each value in the second movie’s property array of genres.
This would take a toll on performance (nested looping and comparison of node properties), and the query would be much more complicated, as well.
The code block below is what the syntax would look like for each query. You can see the shift in logic and complexity of the loop in the second query.
//find the genres for a particular movie
MATCH (m:Movie {title:"The Matrix"})
RETURN m.genre;

//find which movies share genres
MATCH (m1:Movie), (m2:Movie)
WHERE any(x IN m1.genre WHERE x IN m2.genre)
AND m1 <> m2
RETURN m1, m2;
Now, instead, if we were to model our movies and genres as separate nodes and create a relationship between the two, we would come up with a model something like the image below.

This creates a completely separate entity (node) for the genre, allowing you to connect all the movies with a shared genre to that Genre node.
Let us see how this changes our queries.
To find the genres of a particular movie, it first needs to find the Movie node it is looking for (in this case, 'The Matrix'), then find the node that is connected to that movie through the IN_GENRE relationship.
The biggest difference is in the syntax for the second query to find which movies share genres. It is much simpler than our earlier version because it uses a natural, graph pattern (entity-relationship-entity) to find the information needed. First, Cypher finds a movie and the genre it is related to, then looks for a second movie that is in that same genre.
//find the genres for a particular movie
MATCH (m:Movie {title:"The Matrix"}),
      (m)-[:IN_GENRE]->(g:Genre)
RETURN g.name;

//find which movies share genres
MATCH (m1:Movie)-[:IN_GENRE]->(g:Genre),
      (m2:Movie)-[:IN_GENRE]->(g)
RETURN m1, m2, g
Neither version of the data model is worse or better, but the 'best' option highly depends on the types of queries you intend to run against your data.
If you plan to do analysis on individual items and return only details about that entity (like genres on a particular movie), then the first data model would serve perfectly well for your needs. However, if you need to run analysis to find common ground between entities or look at a group of nodes, then the second data model would definitely improve performance of those types of queries.
Complex Data Structures
As many of us can probably agree, not all data models are simple and straightforward. Data is messy, and the model must attempt to better-organize it to help us see patterns and make decisions.
One excellent example of a complex data structure that is difficult to model is Marvel comic data. In the Marvel universe, there are comics that have characters who make appearances or play lead roles. Comics can be organized into a series of particular storylines or narratives for a certain time, and major events can take place in a comic that define a character path or series. Creators (including writers, illustrators, etc) are the authors of comics, defining storyline, character adaptations, and events that happen. Multiple creators can also participate interchangably to create a comic or series.
This dataset already seems complicated, with several entities and relationships at work. It adds a new layer of complexity when trying to model the hierarchies and intermediate entities that exist here.
If you have some time, you can view the full video link to Peter’s presentation on Vimeo, but we want to highlight two key challenges that Peter discusses in the data set.
First, he found that comic characters tend to be extremely dynamic. Many characters cannot be identified by name or costume or any particular property, as all of those change often.
The other problem Peter identified is that of chronology. For those new to the comic universe, some might want to determine where to start or what comic(s) come next. However, comic issues are not always sequentially numbered, and there are even some storylines that appear across multiple series and back again. This makes it incredibly difficult to separate certain blocks of stories or events, along with renditions of characters.
Example: Hyperedges or Intermediate Nodes
One modeling technique that is useful in this model is the concept of a hyperedge. Hyperedges (or intermediate nodes) are often created to model relationships that exist between more than two entities. They are often created to represent the connection of multiple entities at a point in time.
A common example of this is a university course. There may be multiple offerings of the same course with the same instructor in the same building, etc. Each section of the class (or offering) would then become an instance of the course.
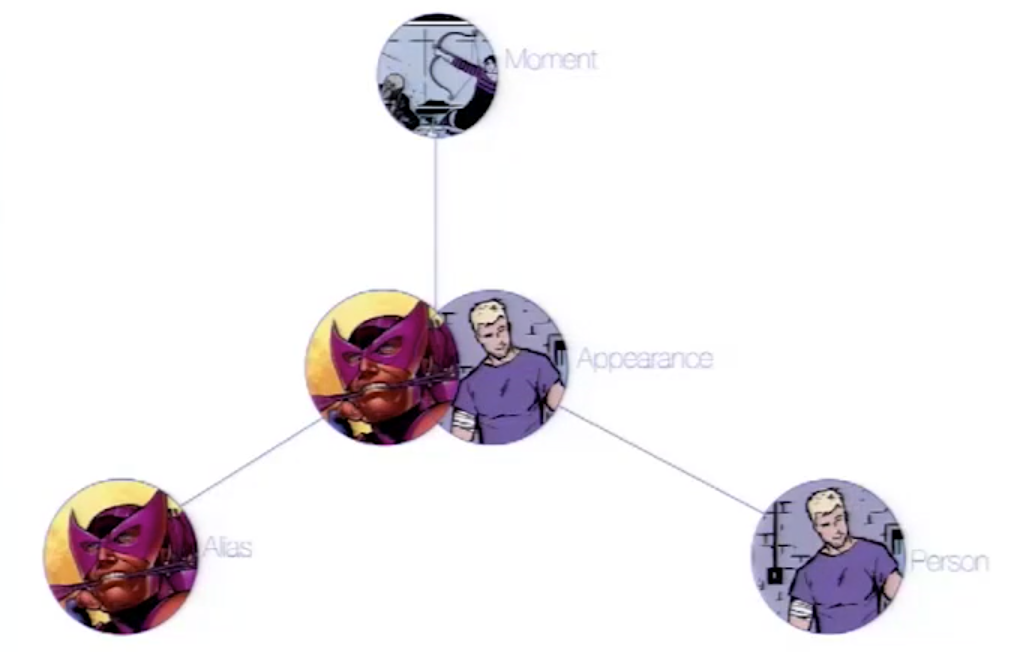
The way Peter at Marvel handled hyperedges in their data is by creating an Appearance node that represents the intersection of a Person and an Alias at a particular time.
This Appearance can be related to multiple Moment nodes where the person and alias appear as a unit.
This is represented in the models shown below (also in the video).
In a relational store, attempting to categorize and relate all of these complicated aspects would be extremely difficult and further complicate analysis and review of the data as a whole. The graph model allowed them to model this heavily dynamic universe and track all of the changing connections throughout their data. For this use case, graph was the perfect fit.
Time-bound Data and Versioning
One way to model time-specific data and relationships is by including data in the relationship type. Because Neo4j is optimized specifically for traversing relationships between entities, you can often improve query performance by specifying a date as the relationship type and only traversing particular dated relationships.
A common example is for modeling airline flights. An airline has a particular flight on a certain day to and from a specific location. We might start with a model like the first image below to show how flights travel from airport to airport.
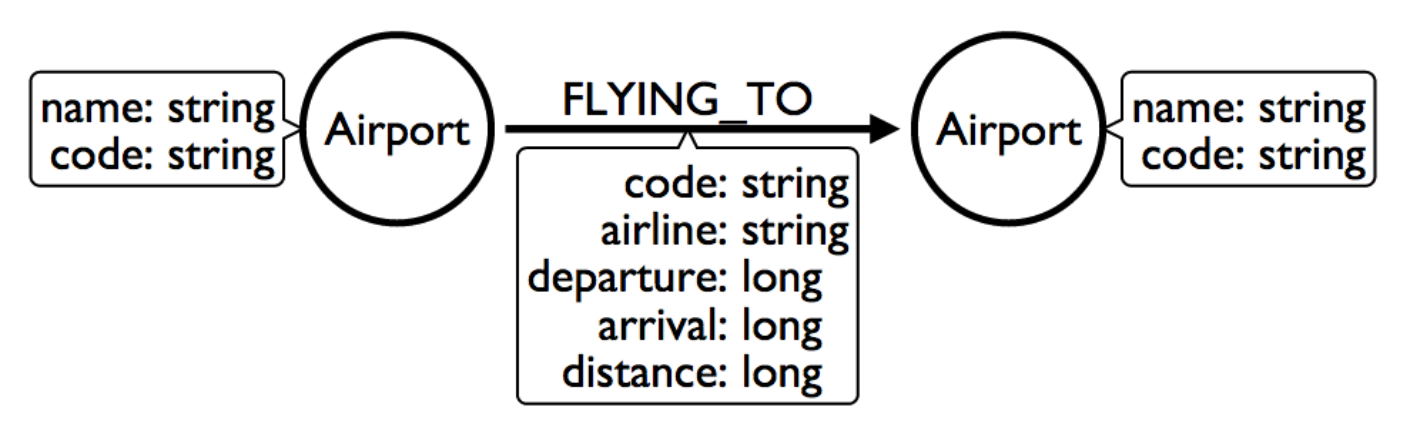
We would soon realize that we need to model a Flight entity that exists between two destinations because multiple planes can travel between two destinations several times in one day.
However, your queries probably will still show the model’s weakness in filtering through all of the flights at a specific airport - especially for London and other major cities that have hundreds of flights connected to an Airport node over any span of time.
Inspecting the several properties of each Flight node could be expensive on resources.
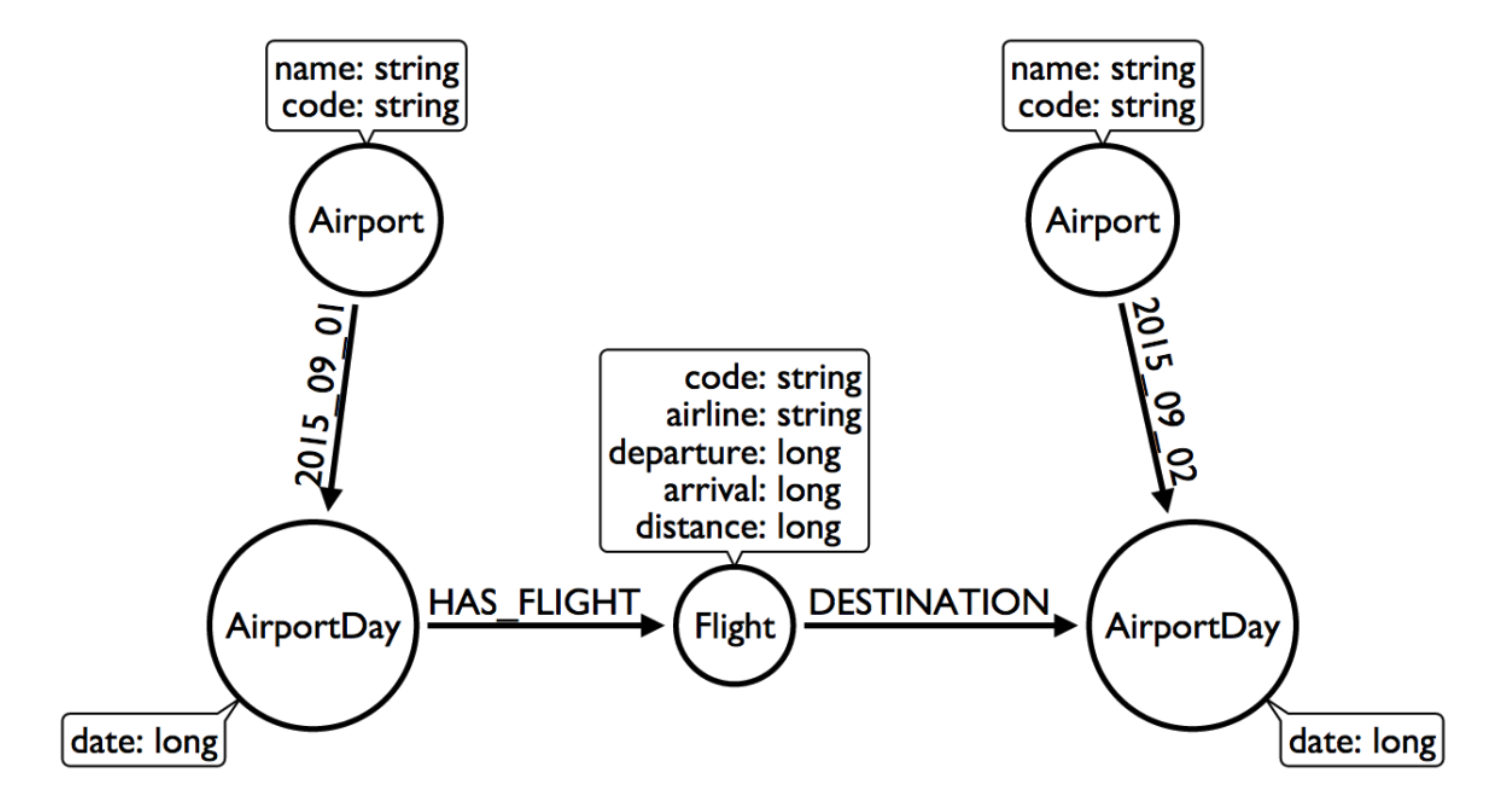
If we were to create a node for a particular airport day and a relationship with a date in the type, then we could write queries to find flights from an airport on any specified date (or date range). This way, you wouldn’t need to check each flight relationship to an airport. Instead, you would only look at the relationships for the dates you cared about. This model turns out like the one below.
For the full walkthrough of the modeling process for airline flights, see Max’s blog post.
Versioning
Similar to the model above where we create a dated relationship type, we can also use this to track versions of our data. Tracking changes in the data structure or showing a current and past value can be incredibly important for auditing purposes, trend analysis, etc.
For instance, if you wanted to create a new effective-dated relationship between a person and their current address, but also retain past addresses, you could use the same principle of including a date in the relationship type. To find the current address of the person, the query would look for the most recently dated relationship.
Taking the Best of Both Worlds
Sometimes, you might find that one model works really well for one scenario you need, but another model is better for something else. For instance, some models will perform better with write queries and other models handle read queries better. Both capabilities are important to your use case, so what do you do?
In these cases, you can combine both models and use the benefits of each. Yes, you can use more than one data model in your graph!
The tradeoff is that now you will need to maintain two models. Each time you create a new node or relationship or update pieces of the graph, you will need to make changes to accommodate both models. This can also impact query performance, as you might have double the syntax needed to update each model.
While this is definitely a possible option, you should know the maintenance costs and evaluate whether those costs are overcome by the performance improvements you will see for each needed query. If so, being able to use more than one data model is a great solution!