Quick start - create a graph
Once the workload has been enabled in your workspace, follow the steps below to create a graph dataset from a Lakehouse and analyze it using Bloom and Query. See Configure for more information on enabling the workload. A sample dataset is provided in this guide to help you get the most out of your trial, and links to other datasets and Notebooks in GitHub are provided at the end of the guide.
You may have up to ten 14-day free trials per organization, but only a single graph item per trial user at any one time.
|
This guide is intended to help users of the Free Trial. Some steps may differ for Neo4j users who have an organization in Aura. |
|
The workspace must be a Fabric workspace, that is, a workspace with a Fabric capacity or Trial assigned to it. My Workspace is a Power BI workspace by default, so creating a Graph Dataset there fails until you assign it a Fabric capacity in its workspace settings. Using a dedicated Fabric workspace is recommended. See Troubleshooting if you encounter the error Can’t create item in current workspace. |
-
Open your Fabric workspace
-
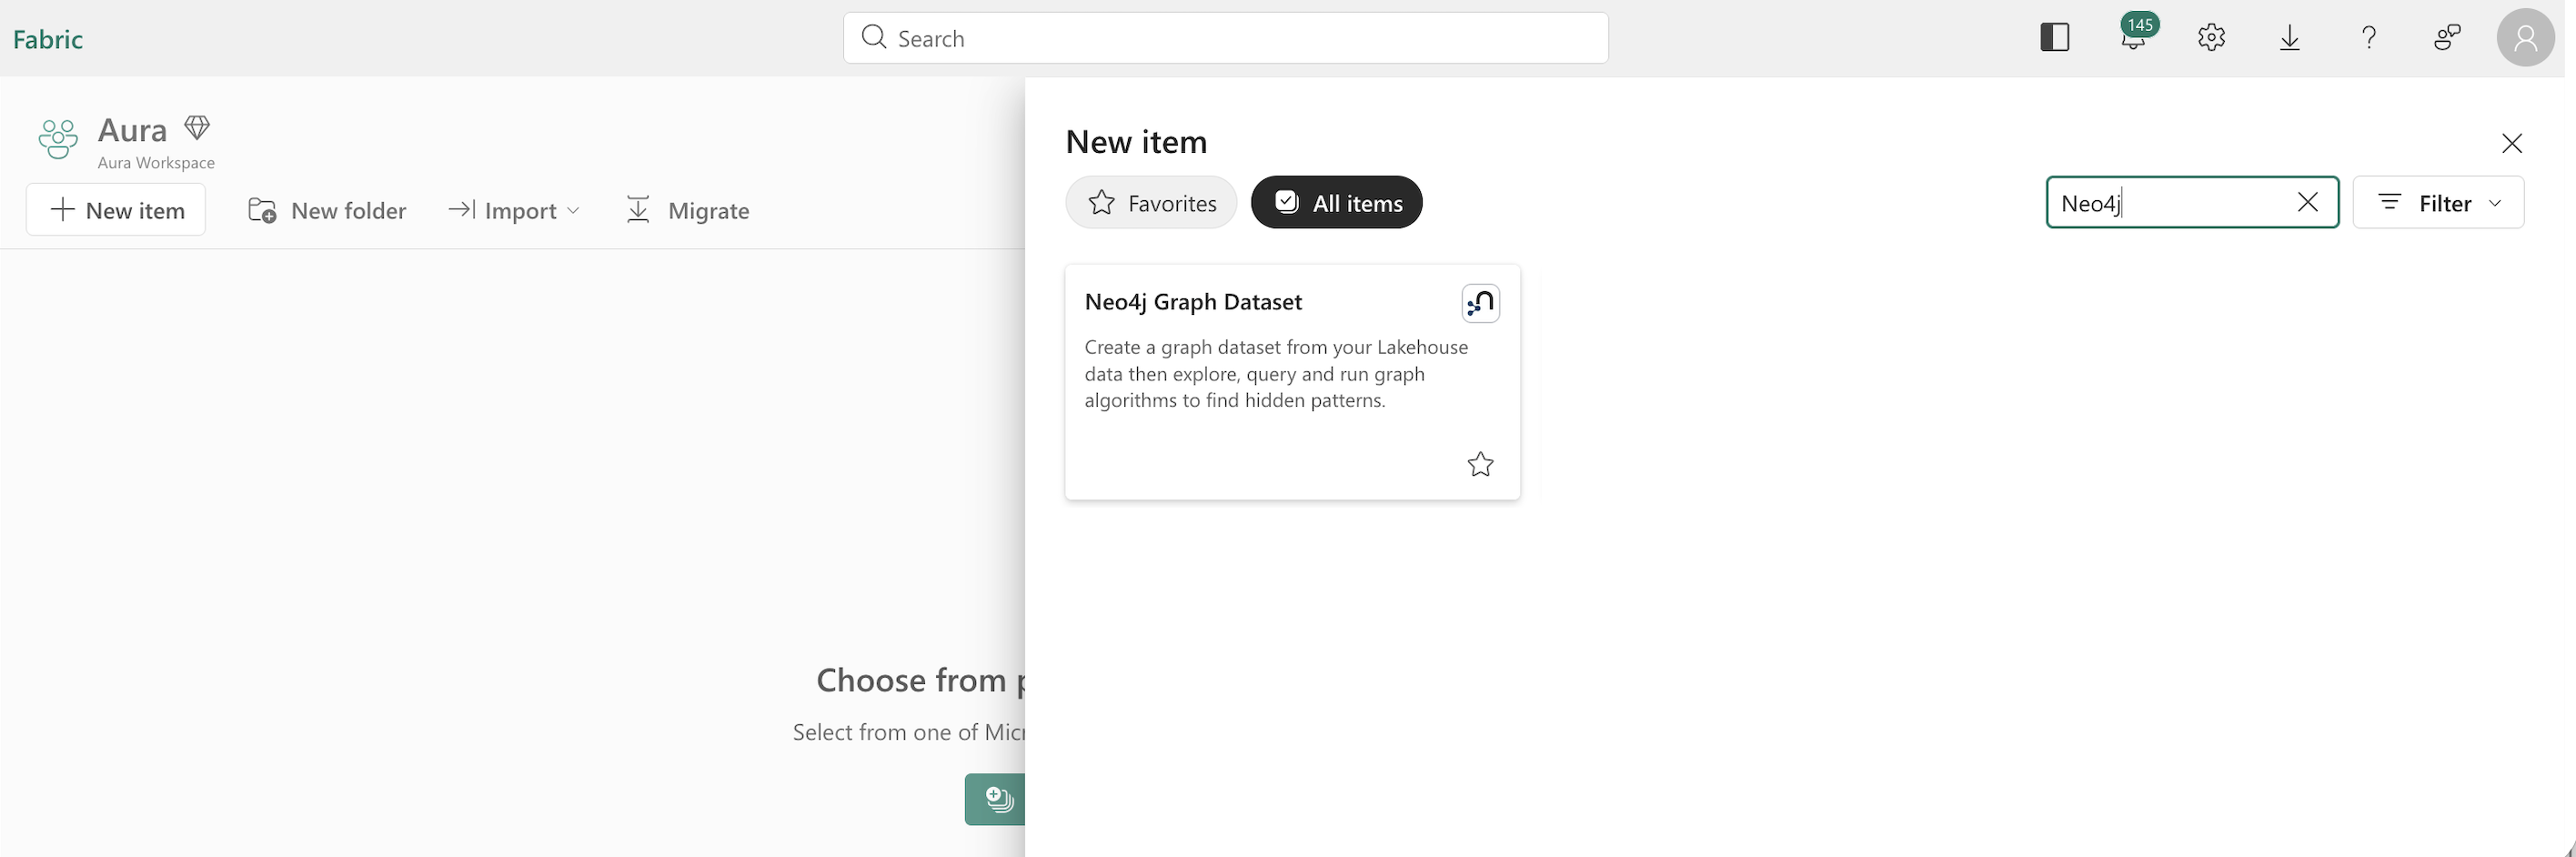
Select New Item → Neo4j Graph Dataset.
-
Provide a name for the dataset, for example
retail graph. -
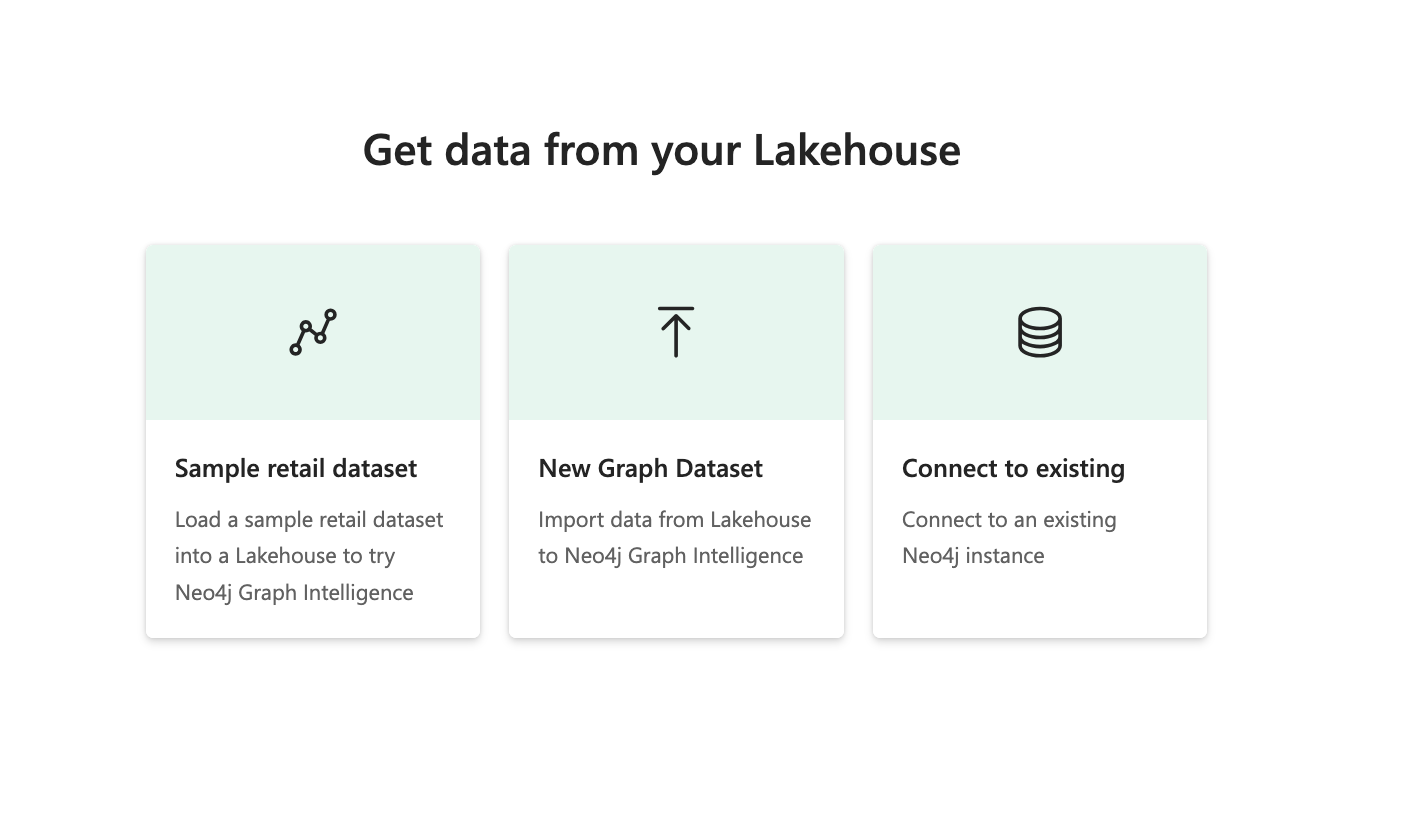
Decide how to proceed:
-
Select Sample retail dataset (recommended) if you need some data to explore.
-
Select New Graph Dataset only if you already have data readily available in OneLake (then continue to Step 5).
-
Ignore Connect to existing. This only applies to organizations that have an Aura Professional or Business Critical database that you want to connect to Fabric.
-
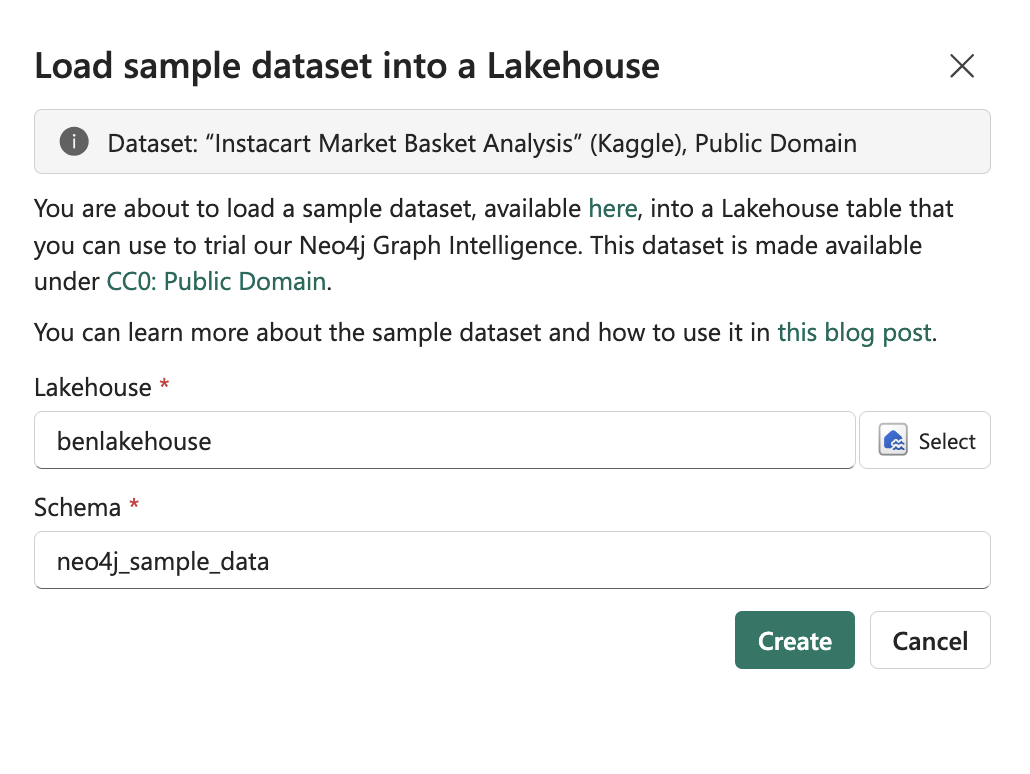
Select an available Lakehouse (must have been created with schema support) or create a new Lakehouse, and then use Create.
-
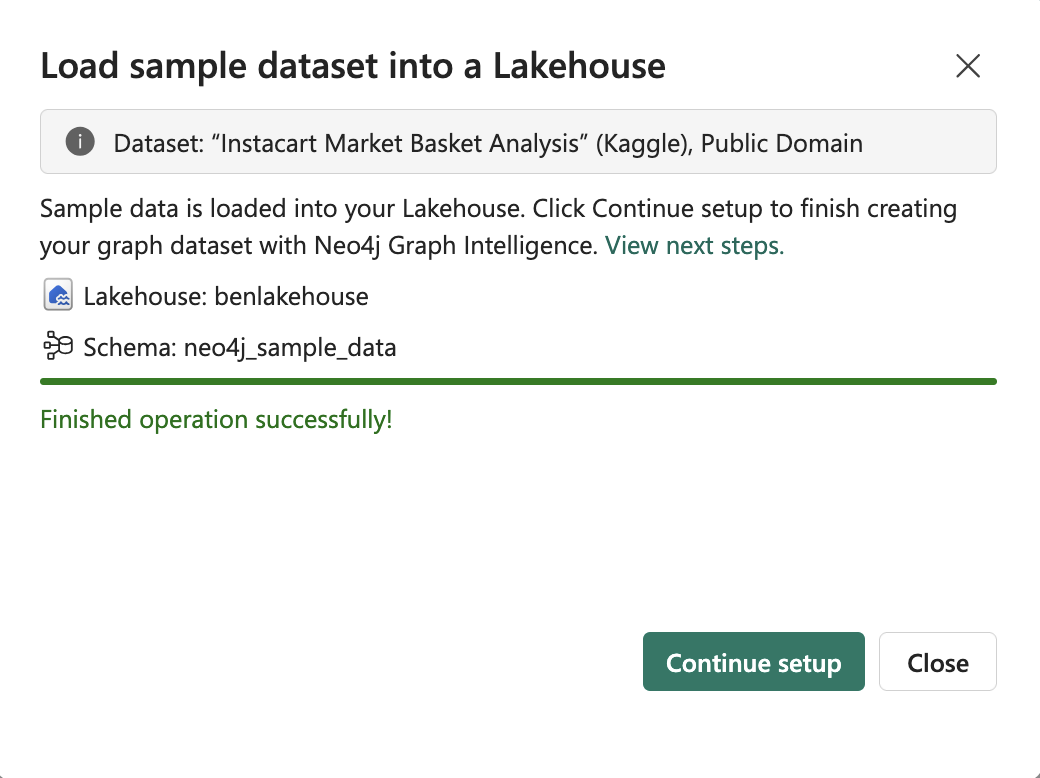
Wait for the tables to be created.
-
Select Continue setup.
-
Select Start trial now to start an AuraDB Professional 14-day trial with 4GB, 1 CPU, and 8GB of storage.
-
If an Aura region is not available for your Fabric region, you will be asked to select your preferred AuraDB region from the list of available regions.
-
Copy and close the credential information, and store it in a password manager. You need this to use Notebooks or to connect from applications that you develop.
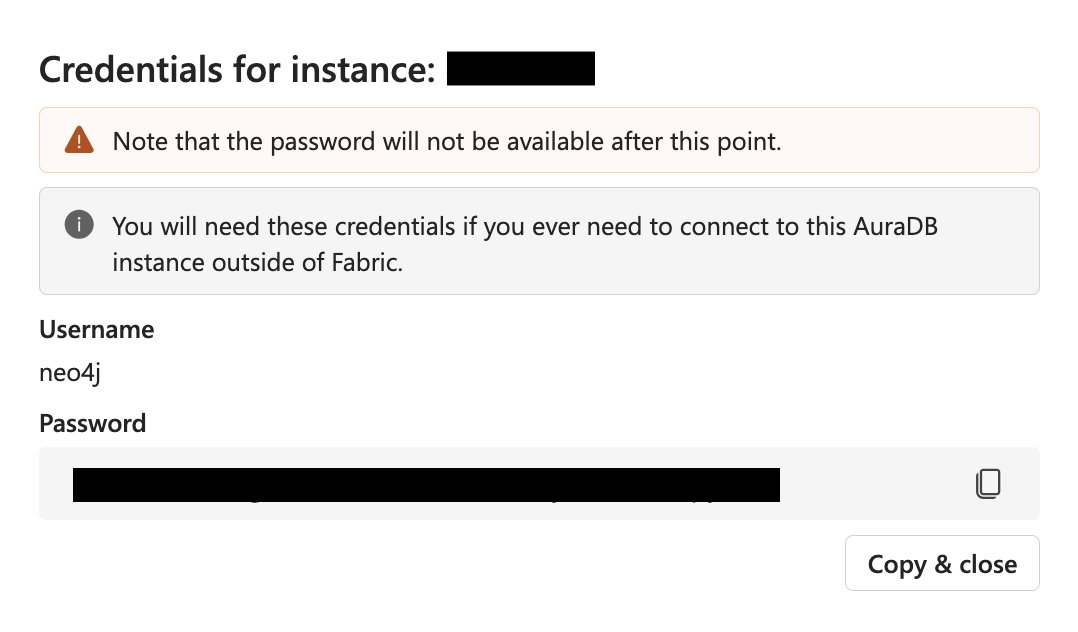
-
Select the Lakehouse with the data you want to use.
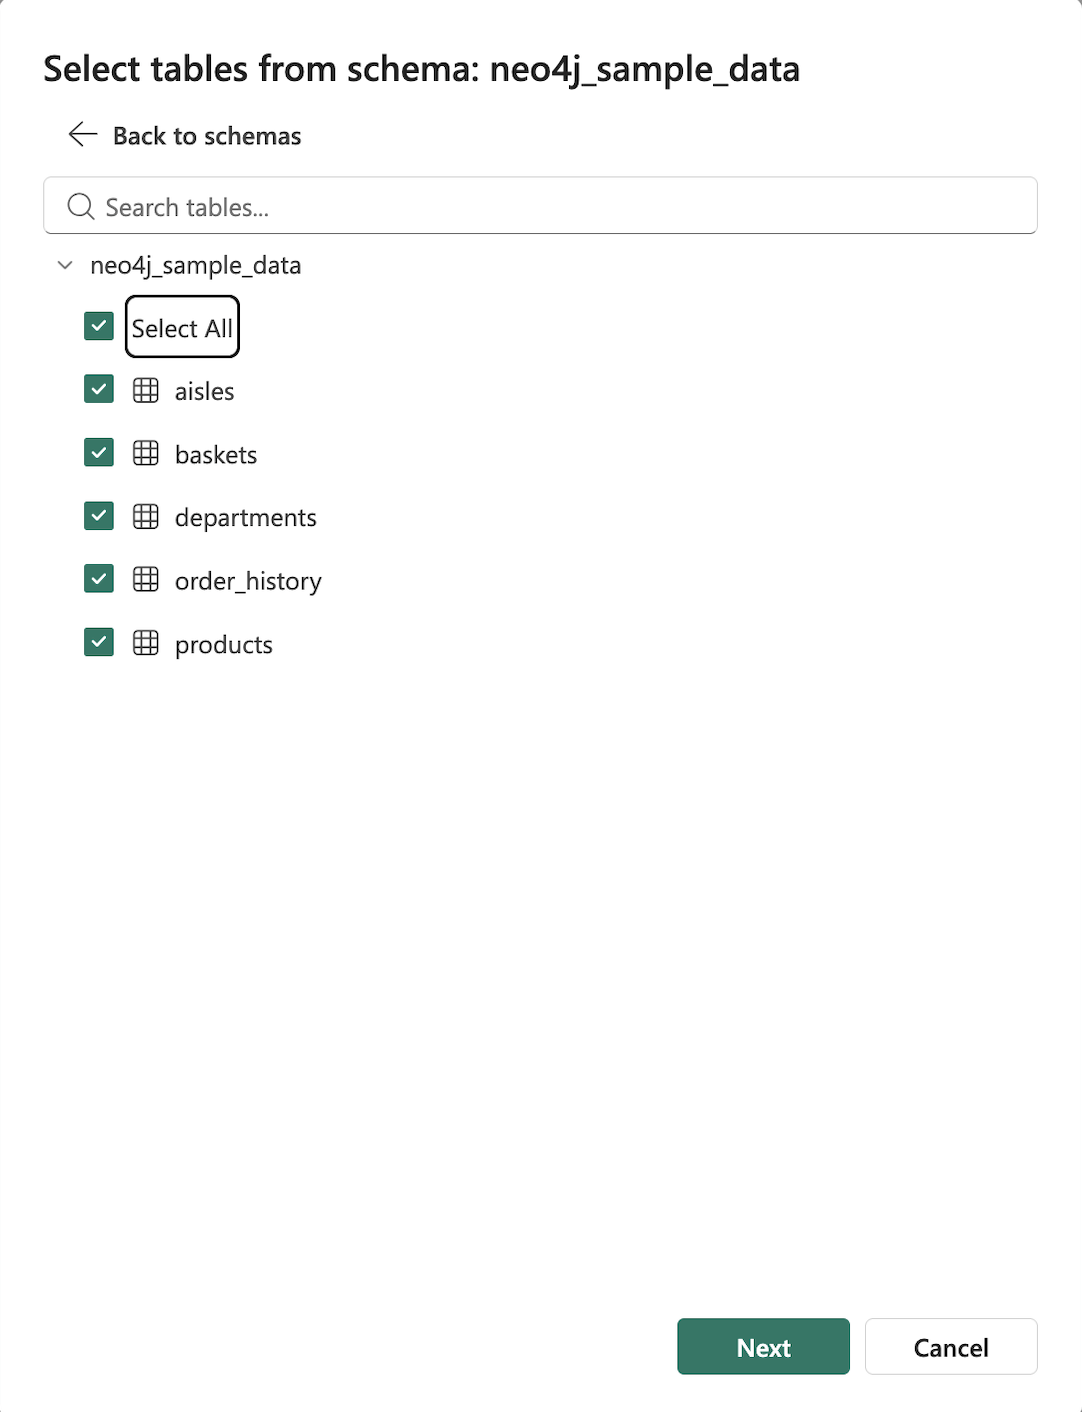
-
Select two or more tables in the Lakehouse, then use Next.
-
Review the AI-assisted graph model, and make any necessary edits.
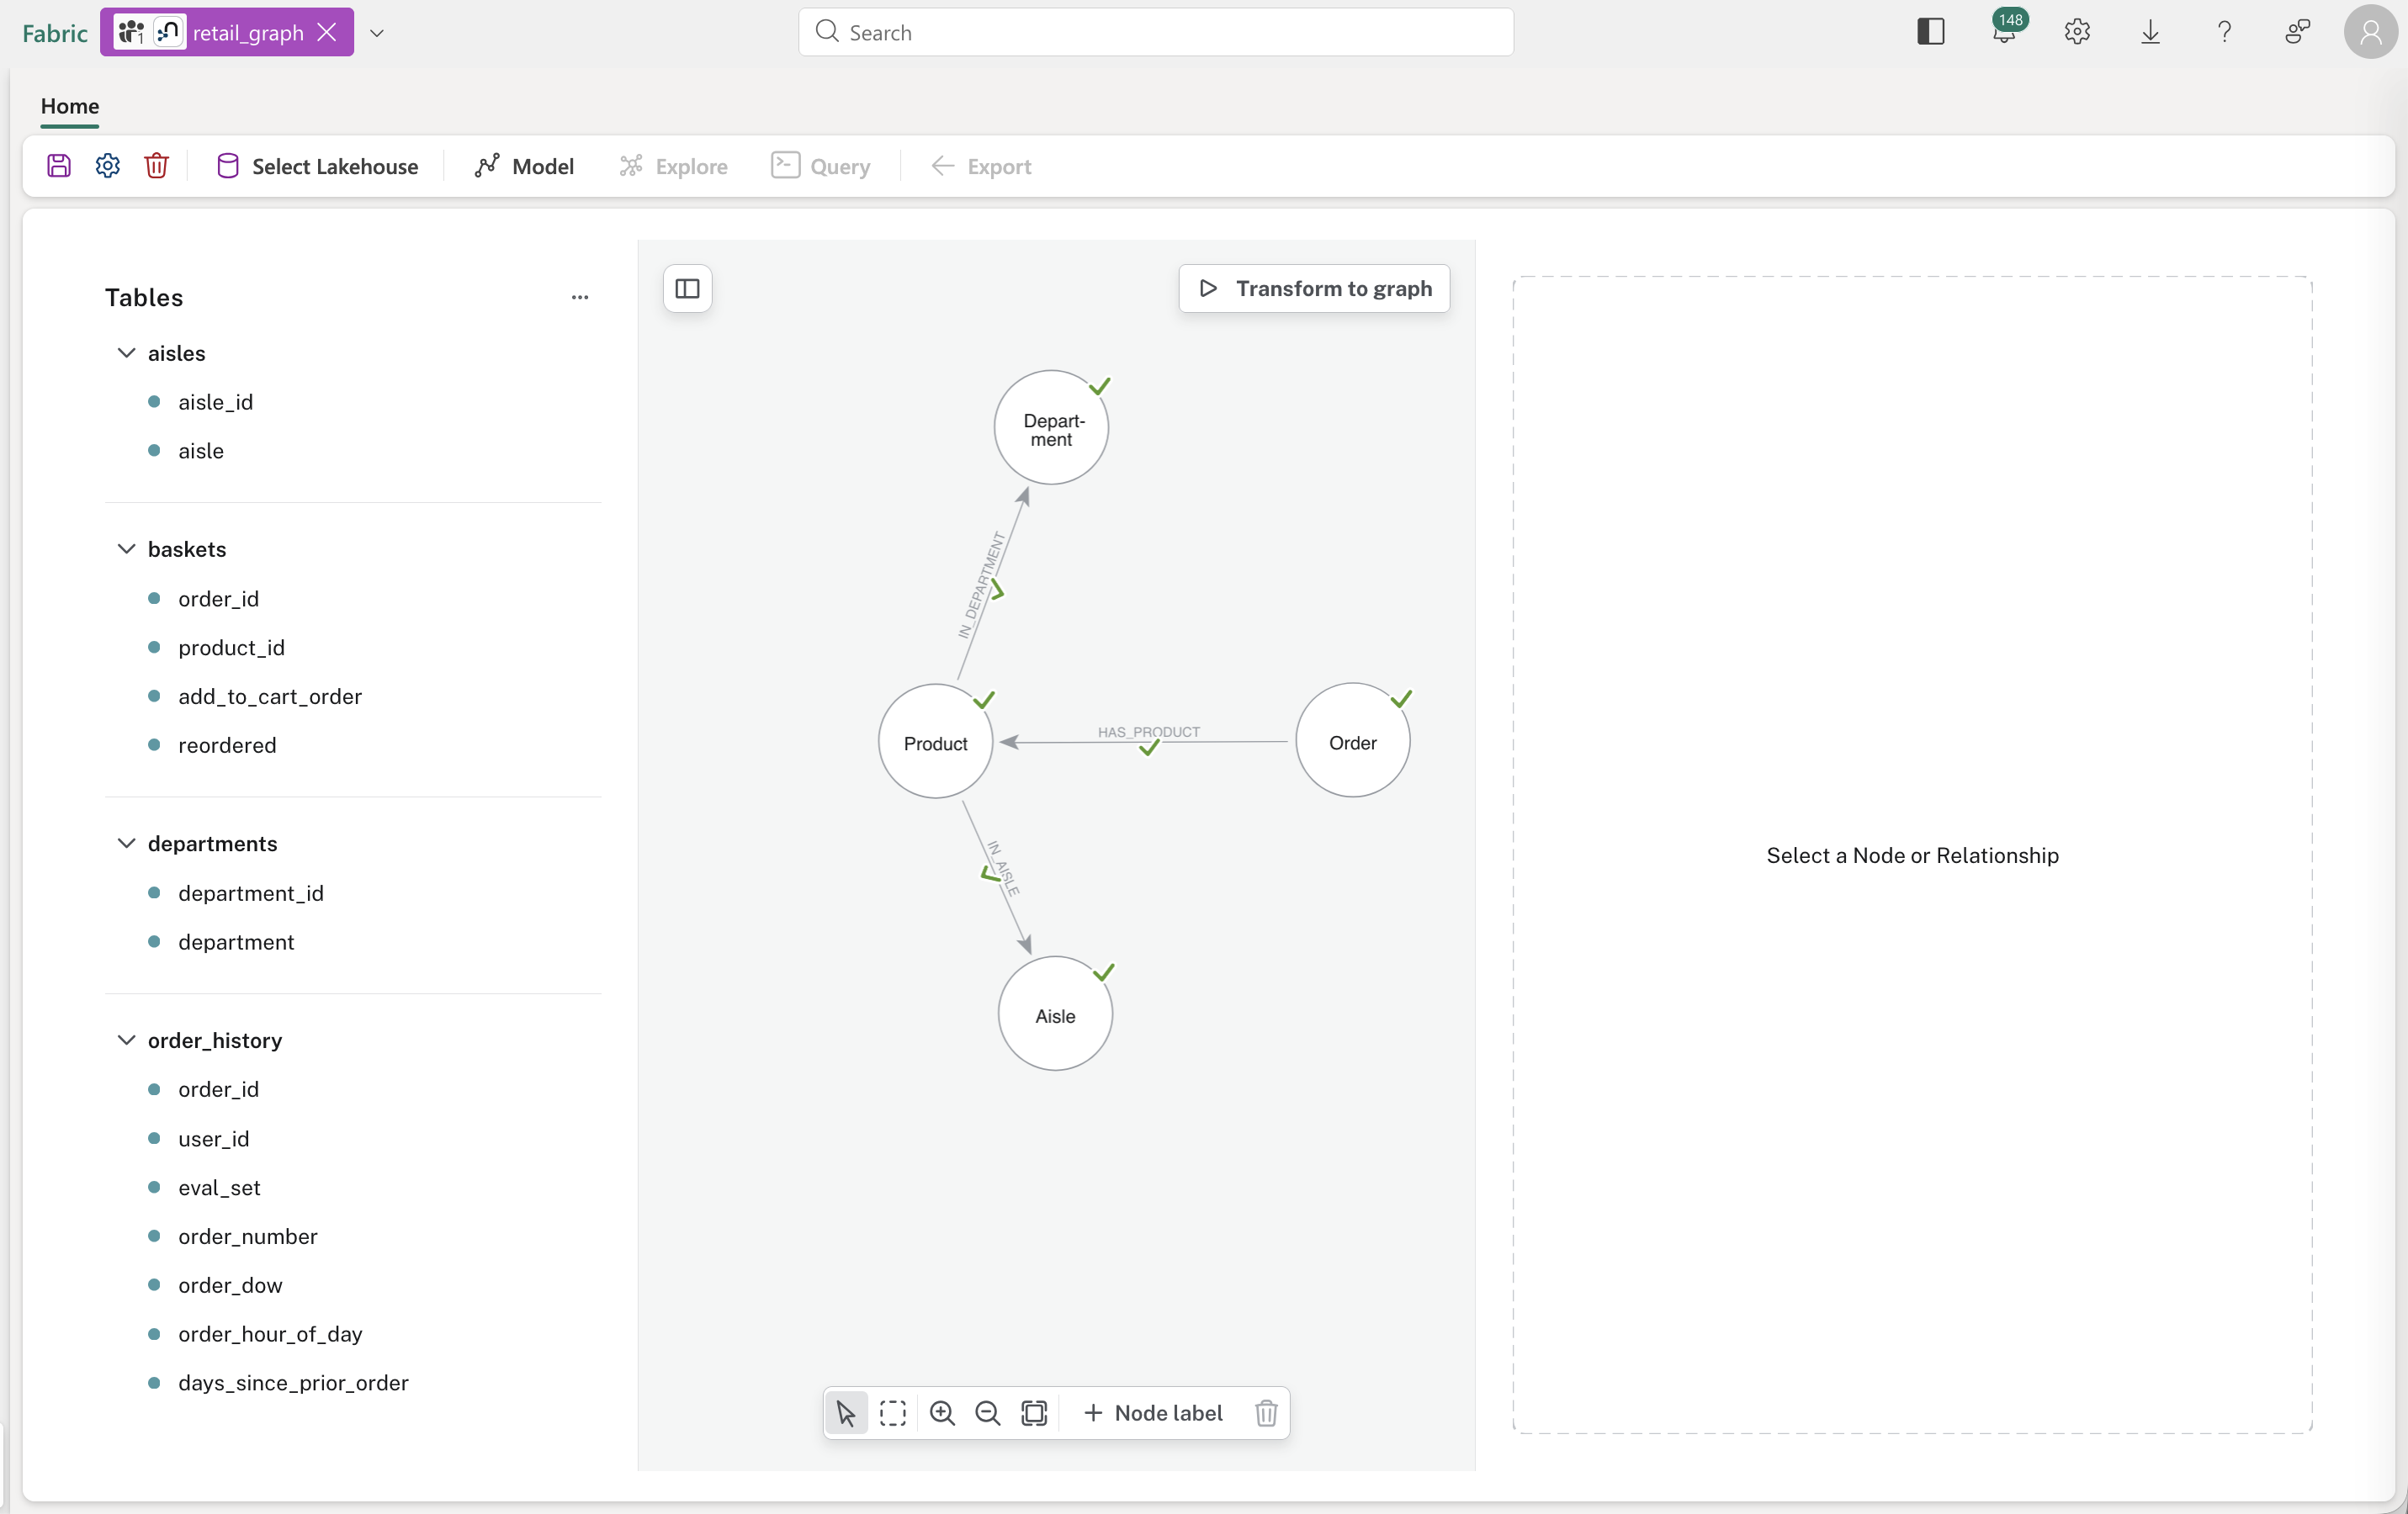
-
Use Transform to graph to create the AuraDB graph database.
-
Wait for the five transformation steps to complete. You will receive an email notification when the task has been completed. Note that the Preview button allows you to advance to start querying the graph while it is being imported.
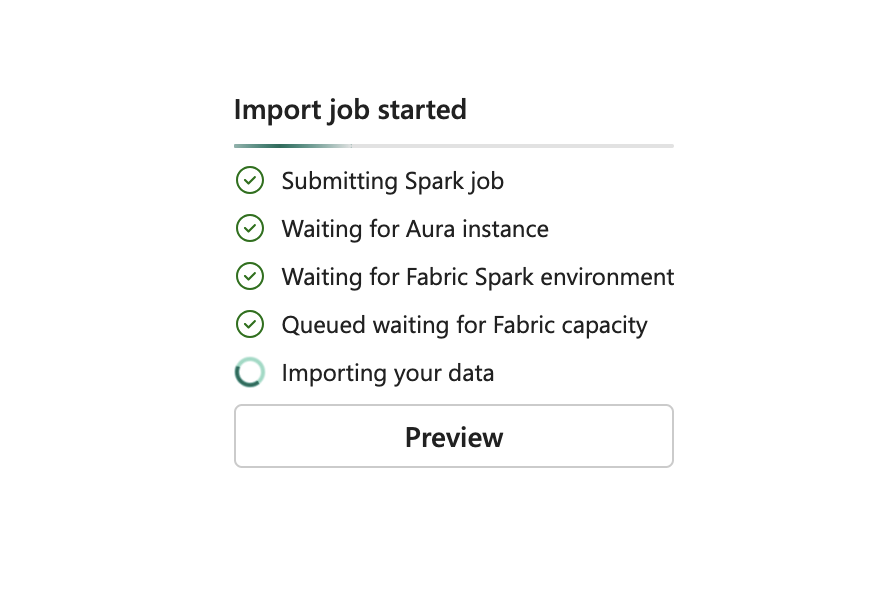
-
If you remain on the progress screen, you are taken to the Query tab once all the data has loaded.
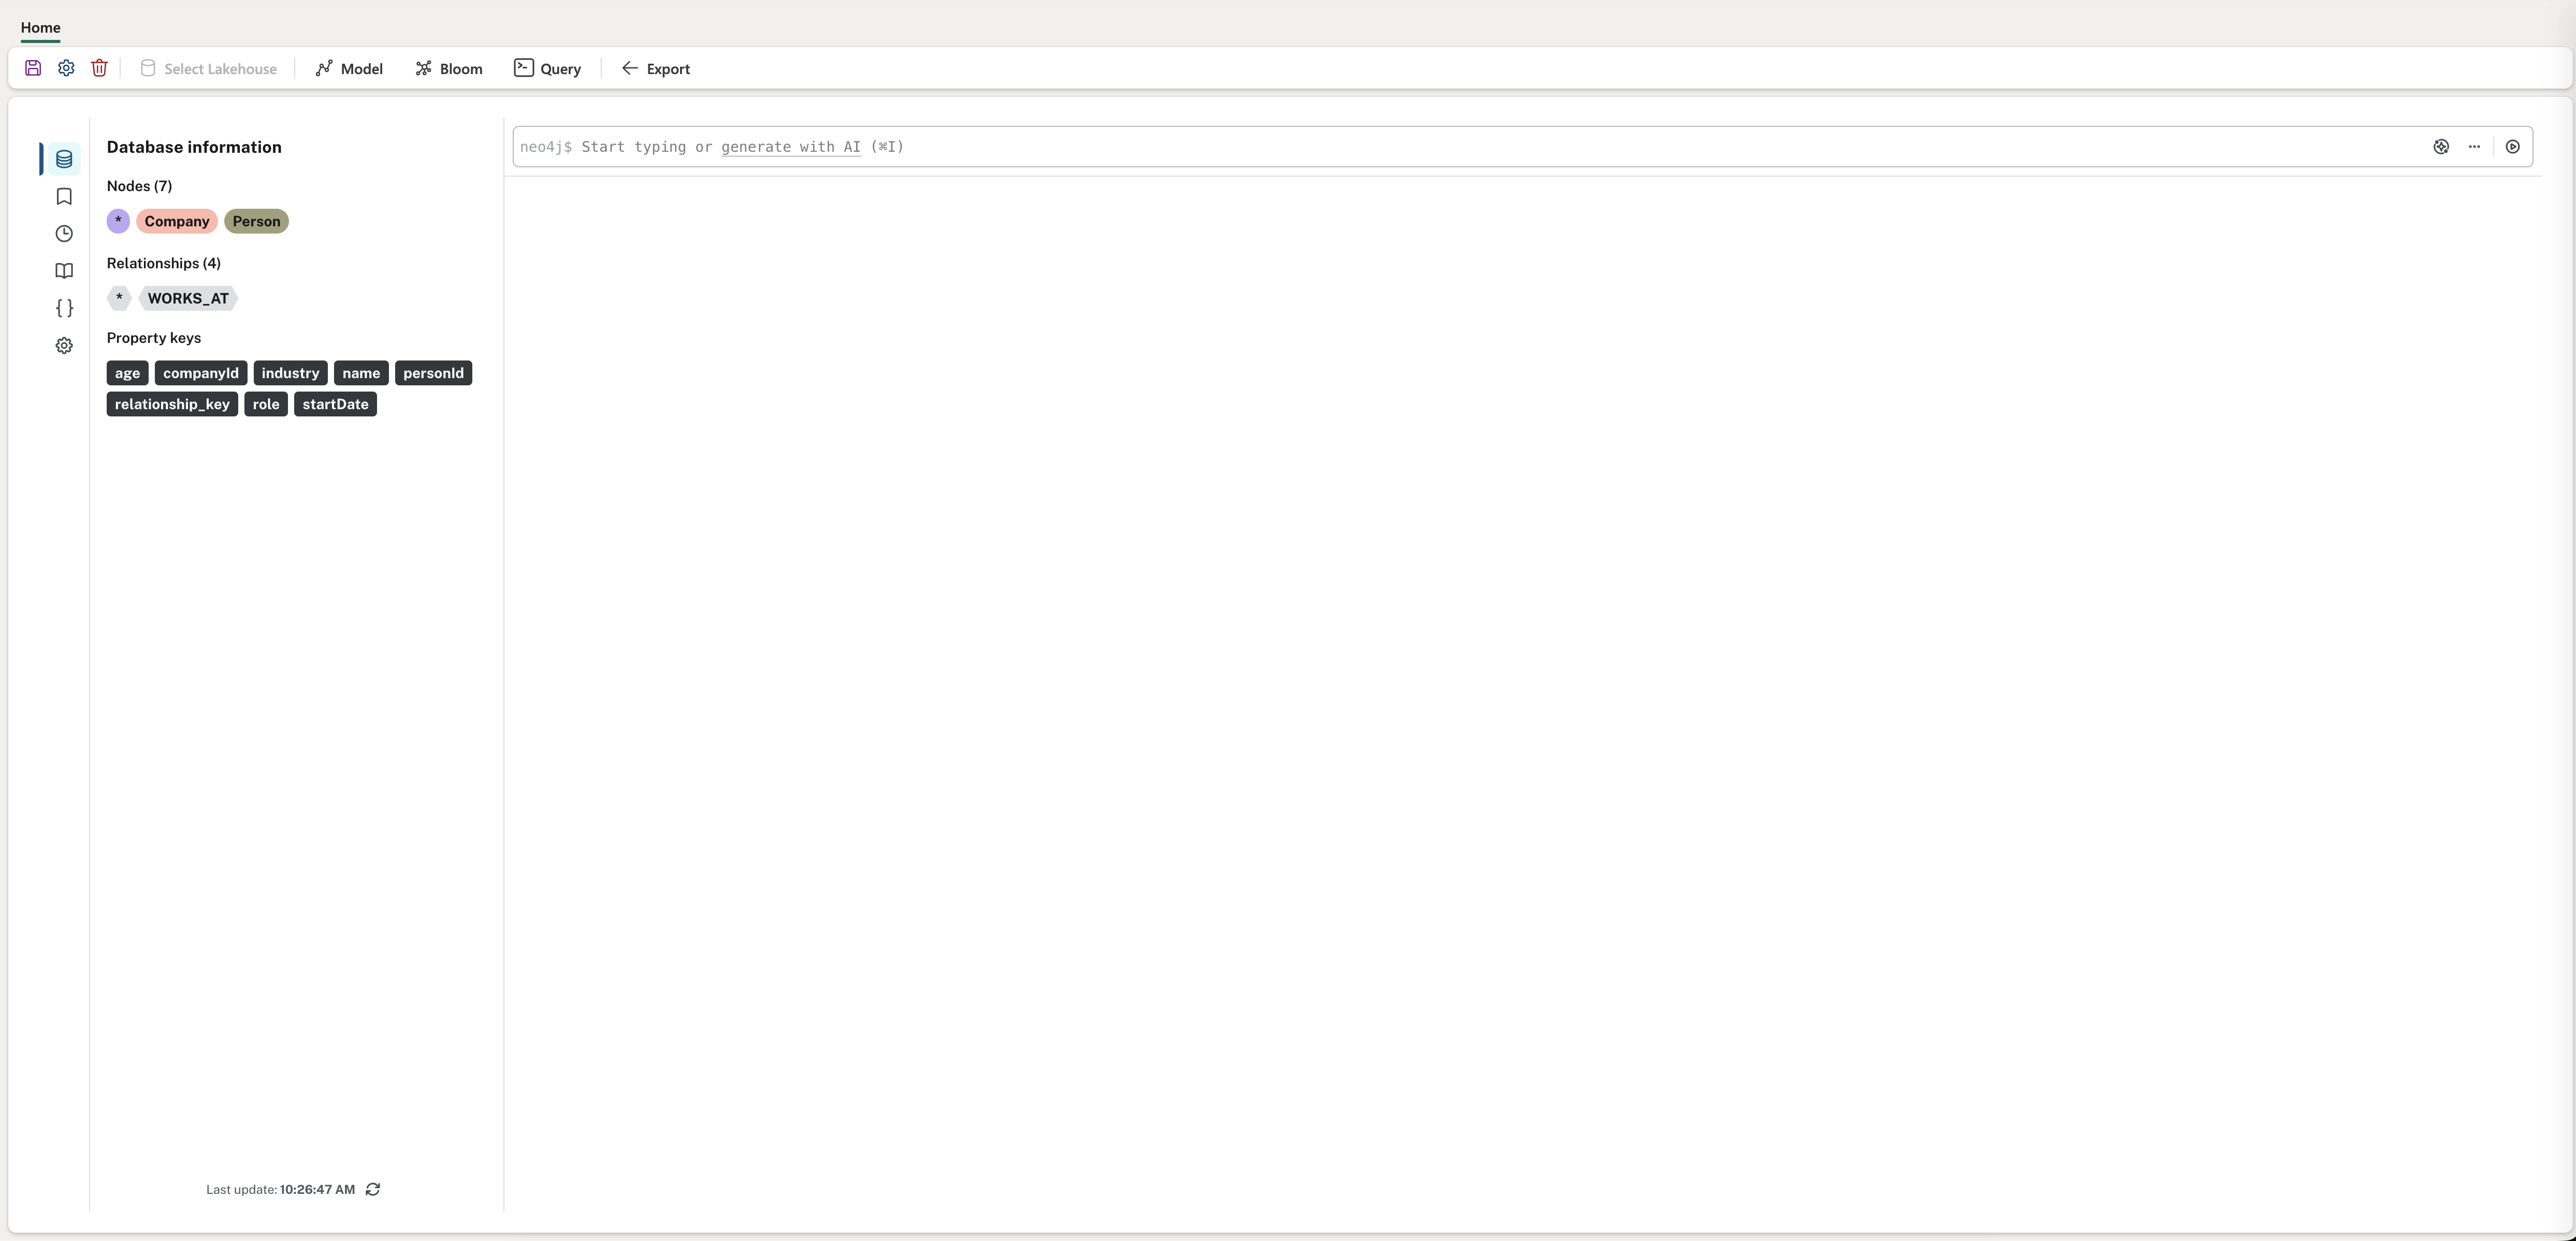
-
Either use Cypher® to query the graph, or press CtrI + I type a prompt for TextCypher to generate Cypher for you.
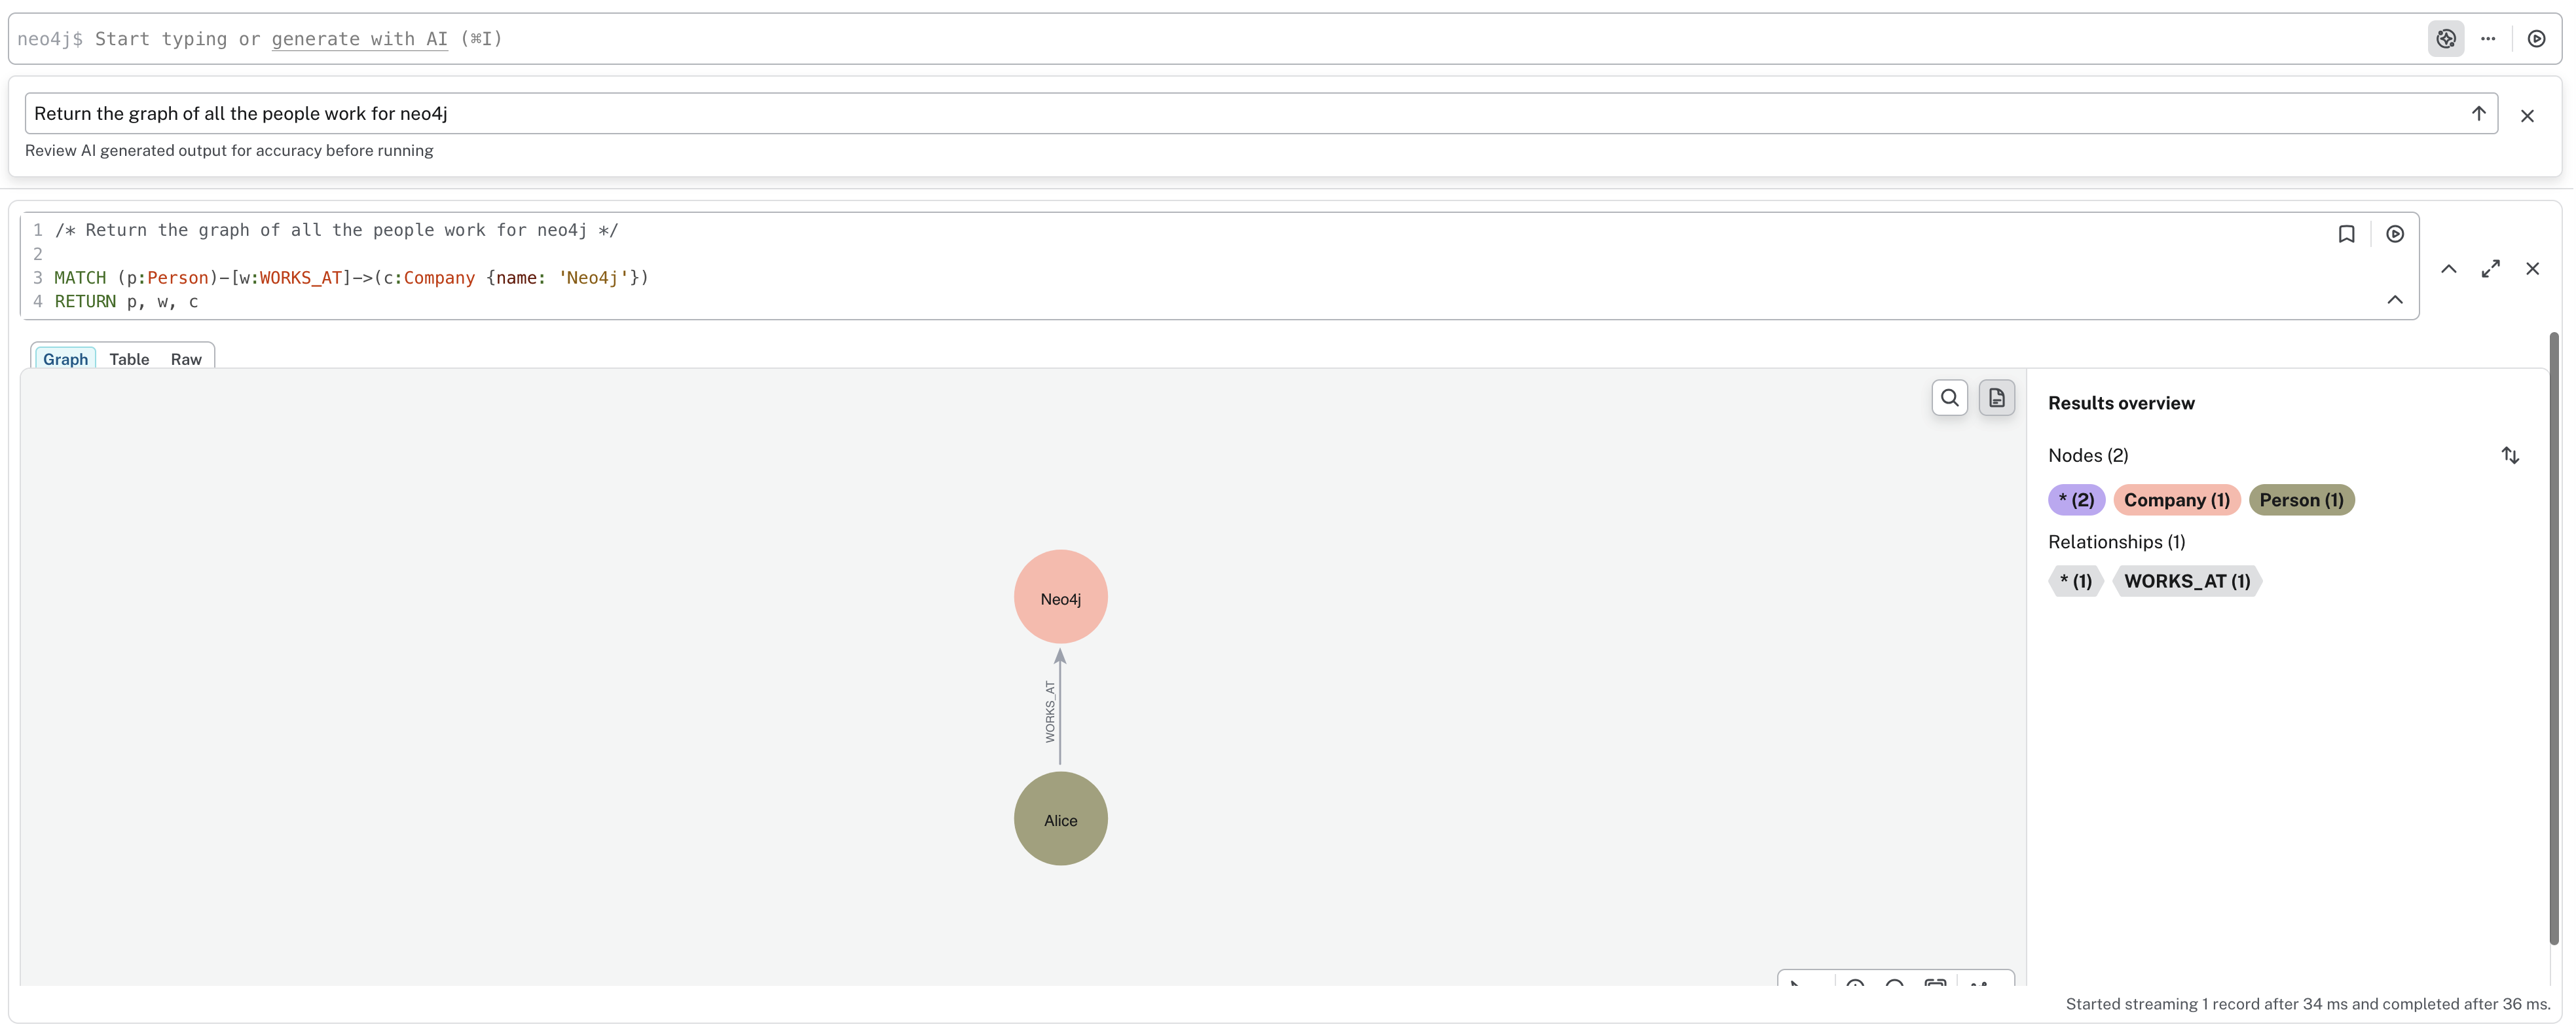
If you used the sample data set, refer to the blog Write Neo4j Graph Intelligence Results Back to OneLake in Fabric, which demonstrates how to run algorithms from a Notebook.
Looking for datasets and inspiration
GitHub has other great examples of data sets and the use of algorithms to solve business problems.
|
If the AuraDB administrator has disabled the Generative AI assistance in Aura, then the Transform button does not use AI to propose a graph model. Refer to Data Modeling for guidance. See Aura Documentation → Aura Organization settings for more information on AI assistance. |