Theoretical considerations
This page details some theoretical concepts related to how link prediction is performed in GDS. It’s not strictly required reading but can be helpful in improving understanding.
Metrics
The Link Prediction pipeline in the Neo4j GDS library supports the following metrics:
-
AUCPR -
OUT_OF_BAG_ERROR(only for RandomForest and only gives a validation score)
The AUCPR metric is an abbreviation for the Area Under the Precision-Recall Curve metric.
For RandomForest models, also the OUT_OF_BAG_ERROR metric is supported.
In order to compute precision and recall we require a set of examples, each of which has a positive or negative label.
For each example we have also a predicted label.
Given the true and predicted labels, we can compute precision and recall (for reference, see f.e. Wikipedia).
Then, to compute the AUCPR, we construct the precision-recall curve, as follows:
-
Each prediction is associated with a prediction strength. We sort the examples in descending order of prediction strength.
-
For all prediction strengths that occur, we use that strength as a threshold and consider all examples of that strength or higher to be positively labeled.
-
We now compute precision
pand recallrand consider the tuple(r, p)as a point on a curve, the precision-recall curve. -
Finally, the curve is linearly interpolated and the area is computed as a union of trapezoids with corners on the points.
The curve will have a shape that looks something like this:
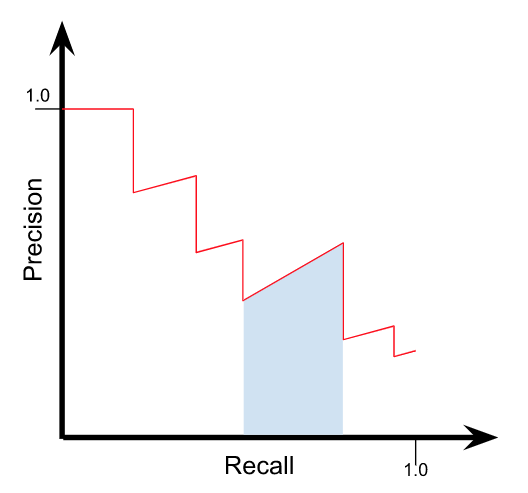
Note here the blue area which shows one trapezoid under the curve.
The area under the Precision-Recall curve can also be interpreted as an average precision where the average is over different classification thresholds.
The OUT_OF_BAG_ERROR is computed only for RandomForest models and is evaluated as the accuracy of majority voting, where for each example only the trees that did not use that example during training are considered.
The proportion the train set used by each tree is controlled by the configuration parameter numberOfSamplesRatio.
OUT_OF_BAG_ERROR is reported as a validation score when evaluated during the cross-validation phase. In the case when a random forest model wins, it is reported as a test score based on retraining the model on the entire train set.
Class imbalance
Most graphs have far more non-adjacent node pairs than adjacent ones (e.g. sparse graphs).
Thus, typically we have an issue with class imbalance.
There are multiple strategies to account for imbalanced data.
In pipeline training procedure, the AUCPR metric is used.
It is considered more suitable than the commonly used AUROC (Area Under the Receiver Operating Characteristic) metric for imbalanced data.
For the metric to appropriately reflect both positive (adjacent node pairs) and negative (non-adjacent node pairs) examples, we provide the ability to both control the ratio of sampling between the classes, and to control the relative weight of classes via negativeClassWeight.
The former is configured by the configuration parameter negativeSamplingRatio in configureSplits when using that procedure to generate the train and test sets.
Tuning the negativeClassWeight, which is explained below, means weighting up or down the false positives when computing precision.
The recommended value for negativeSamplingRatio is the true class ratio of the graph, in other words, not applying undersampling.
However, the higher the value, the bigger the test set and thus the time to evaluate.
The ratio of total probability mass of negative versus positive examples in the test set is approximately negativeSamplingRatio * negativeClassWeight.
Thus, both of these parameters can be adjusted in tandem to trade off evaluation accuracy with speed.
The true class ratio is computed as (q - r) / r, where q = n(n-1)/2 is the number of possible undirected relationships, and r is the number of actual undirected relationships.
Please note that the relationshipCount reported by the graph list procedure is the directed count of relationships summed over all existing relationship types.
Thus, we recommend using Cypher to obtain r on the source Neo4j graph.
For example, this query will count the number of relationships of type T or R:
MATCH (a)-[rel:T | R]-(b)
WHERE a < b
RETURN count(rel) AS r
When choosing a value for negativeClassWeight, two factors should be considered.
First, the desired ratio of total probability mass of negative versus positive examples in the test set.
Second, what the ratio of sampled negative examples to positive examples was in the test set.
To be consistent with traditional evaluation, one should choose parameters so that negativeSamplingRatio * negativeClassWeight = 1.0, for example by setting the values to the true class ratio and its reciprocal, or both values to 1.0.
Alternatively, one can aim for the ratio of total probability weight between the classes to be close to the true class ratio.
That is, making sure negativeSamplingRatio * negativeClassWeight is close to the true class ratio.
The reported metric (AUCPR) then better reflects the expected precision on unseen highly imbalanced data.
With this type of evaluation one has to adjust expectations as the metric value then becomes much smaller.