Rule-based styling
Make tables easier to scan and interpret at a glance by adding styling rules to color important values. Styling updates dynamically as your data changes. Apply styling to cells, rows, and text, or use color ranges to emphasize numeric values.
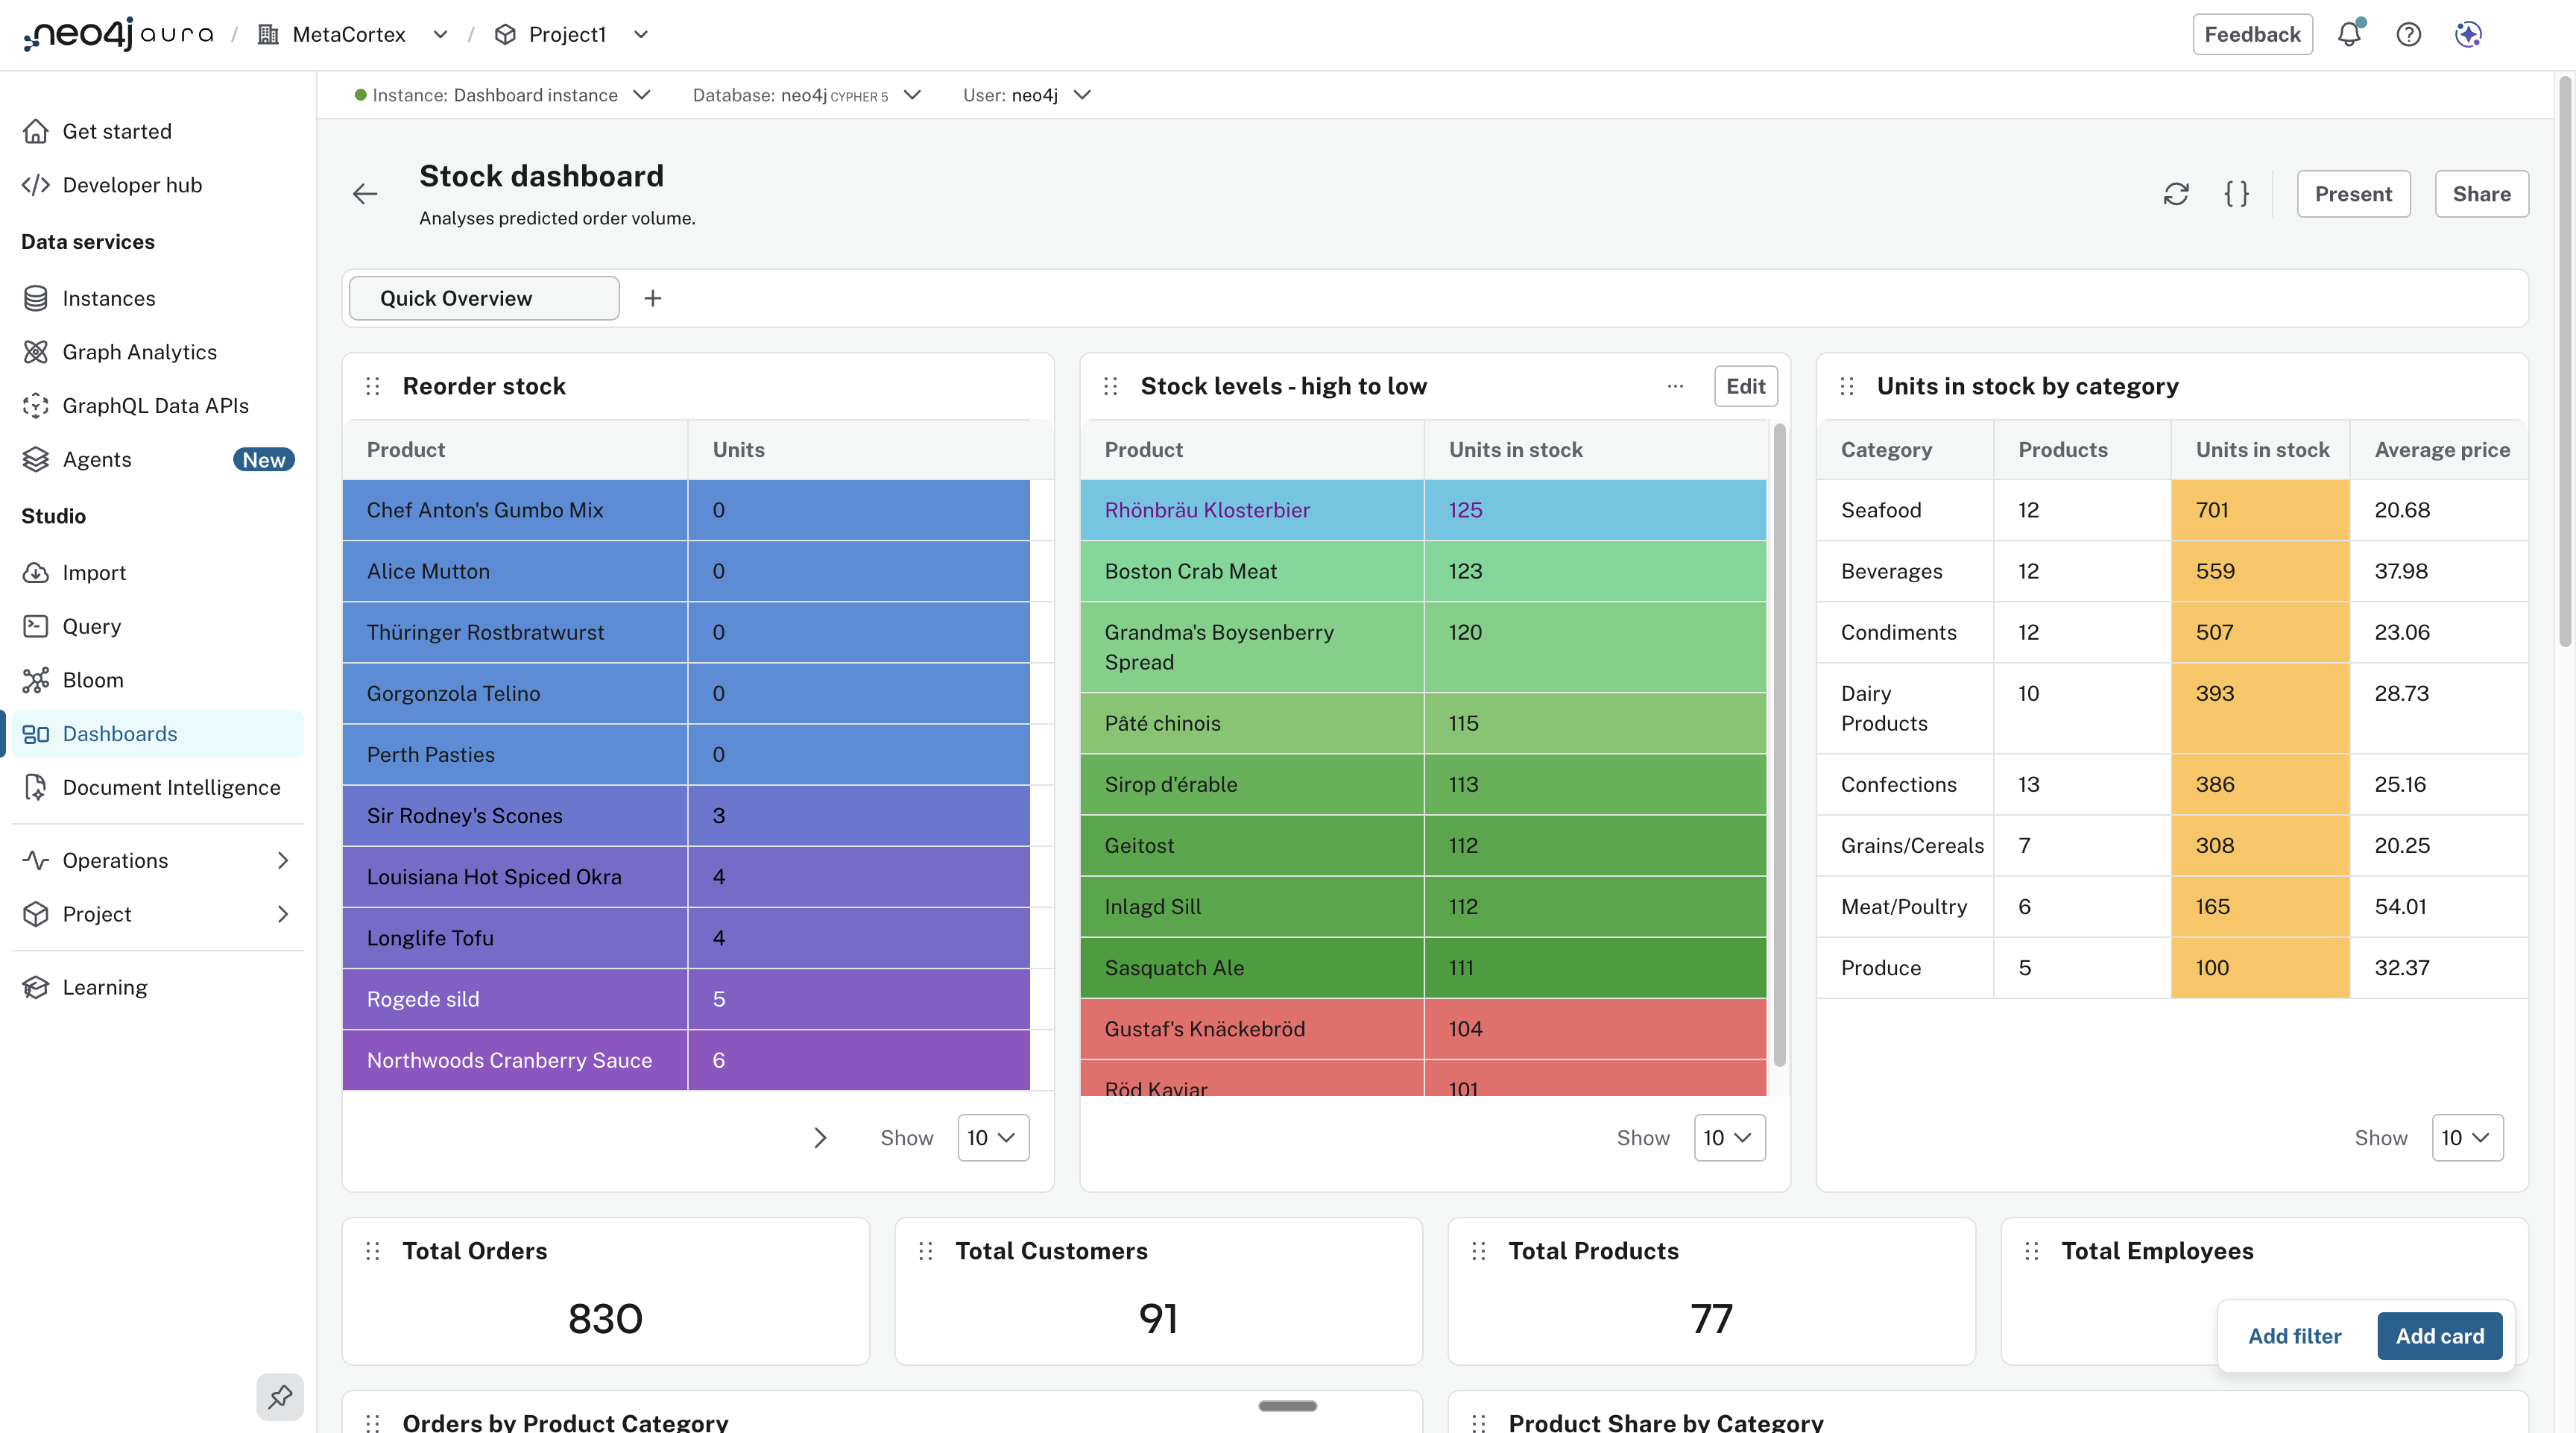
To create a styling rule:
-
Open a Table visualization and select the Styling tab
-
Select Add
-
Configure the rule and select Apply
-
Select Add to create the rule
|
Select Save on the card to save your changes. Closing the card before selecting Save discards the changes. |
You can create multiple styling rules. Rules are applied from top to bottom, so drag and drop them to change their priority.
Style a stock-level table
The following example uses the Northwind dataset. It shows you how to use styling rules to make high and low stock levels easier to identify. Create a table visualization with the following Cypher:
MATCH (p:Product)
RETURN p.productName AS Product, p.unitsInStock AS `Units in stock`
ORDER BY `Units in stock` DESC
LIMIT 10
Highlight high stock levels
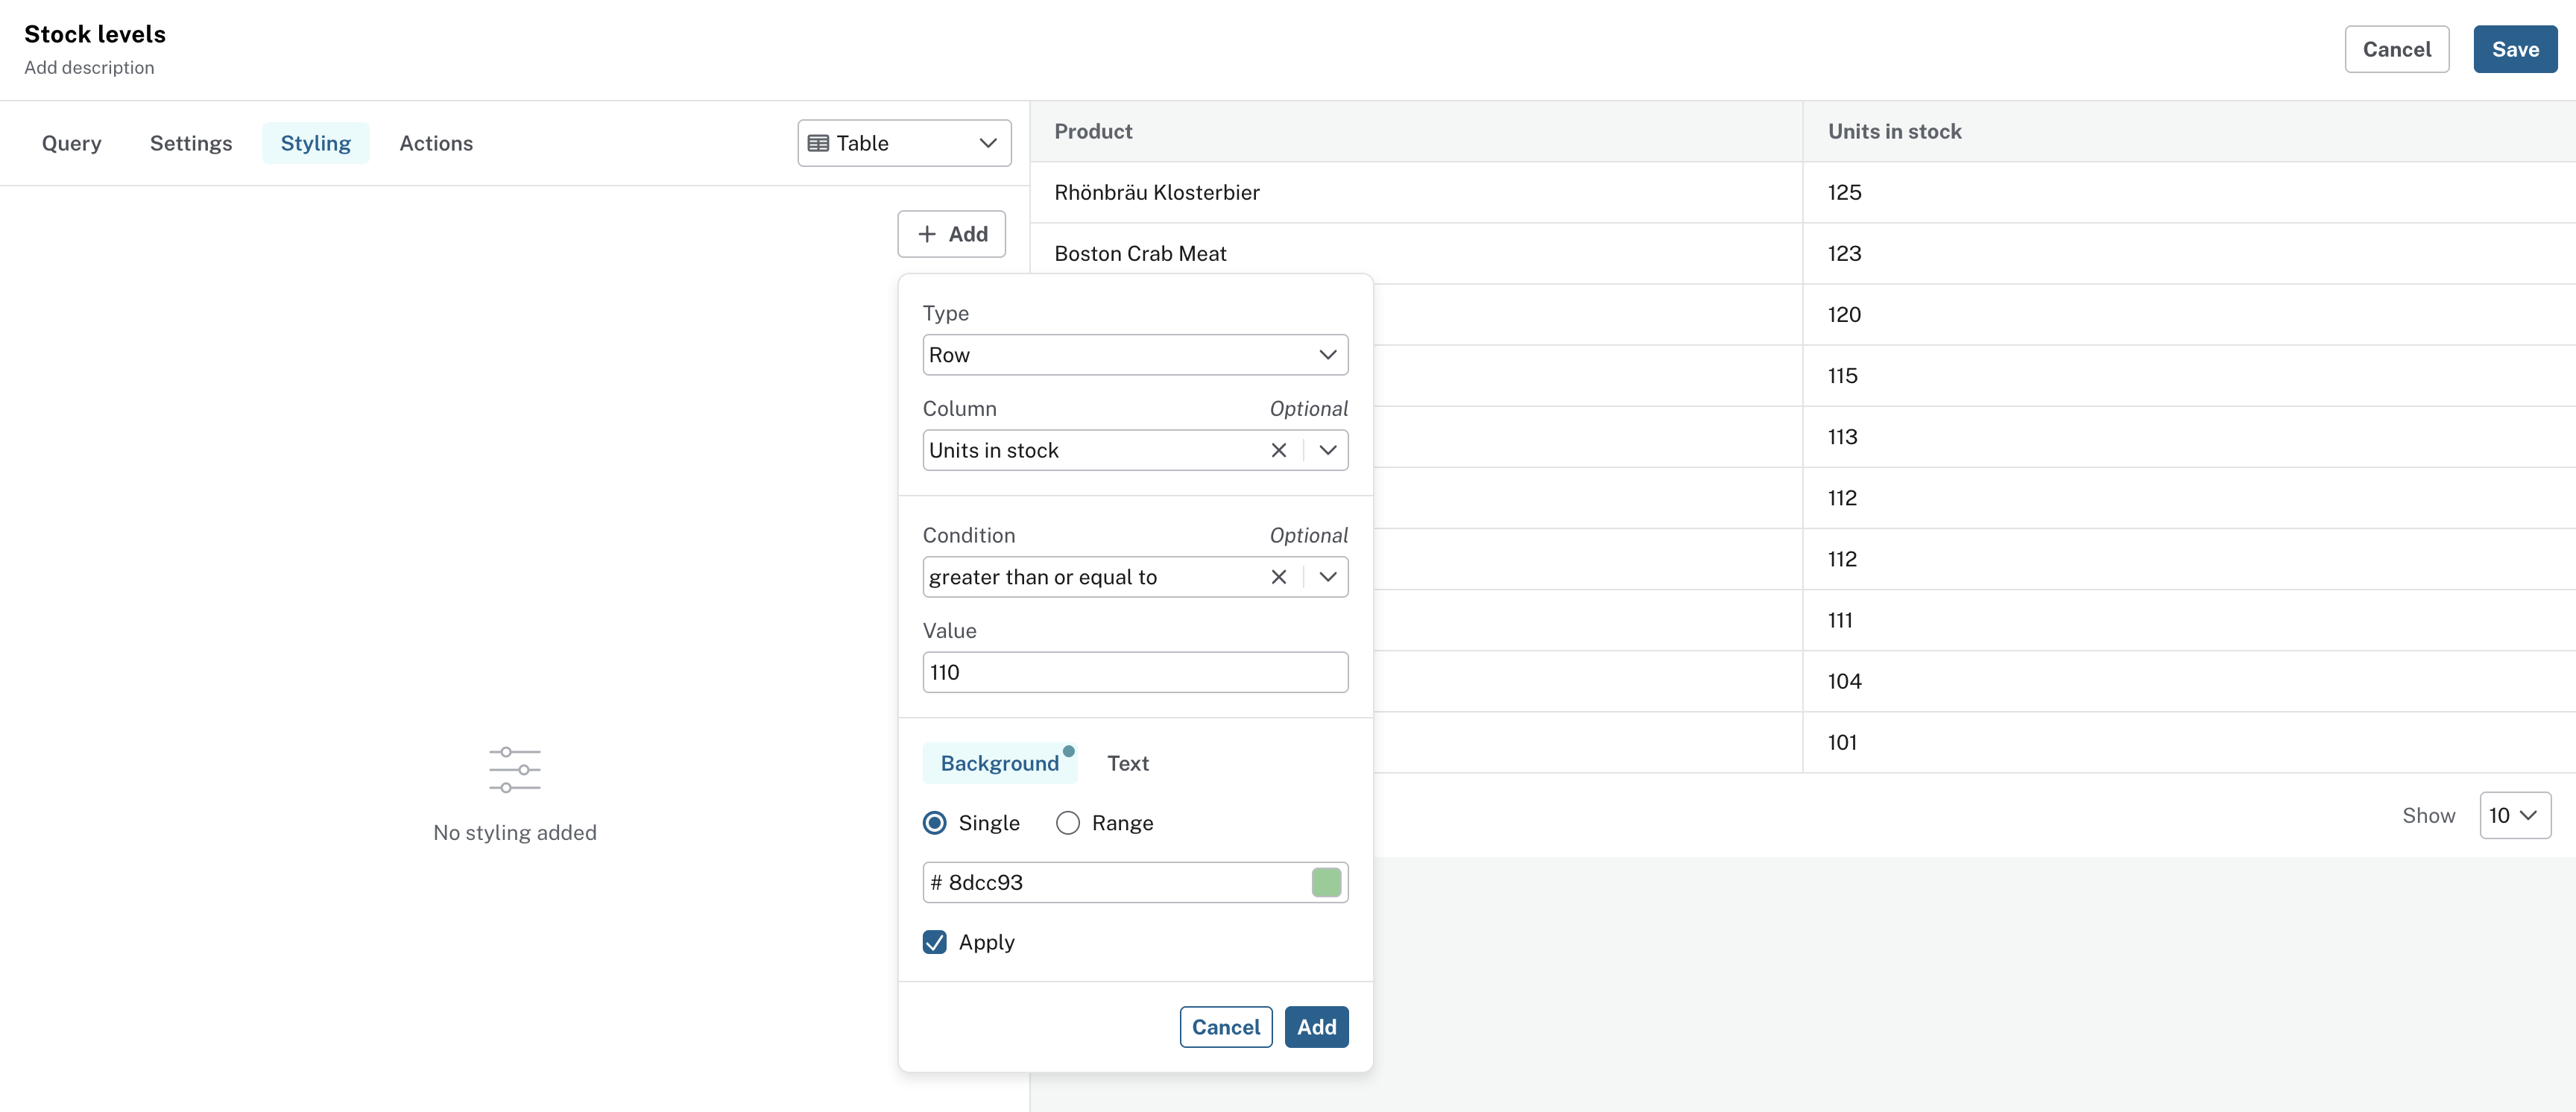
Create a rule that applies a green background to Units in stock values greater than or equal to 110.
Highlight low stock levels
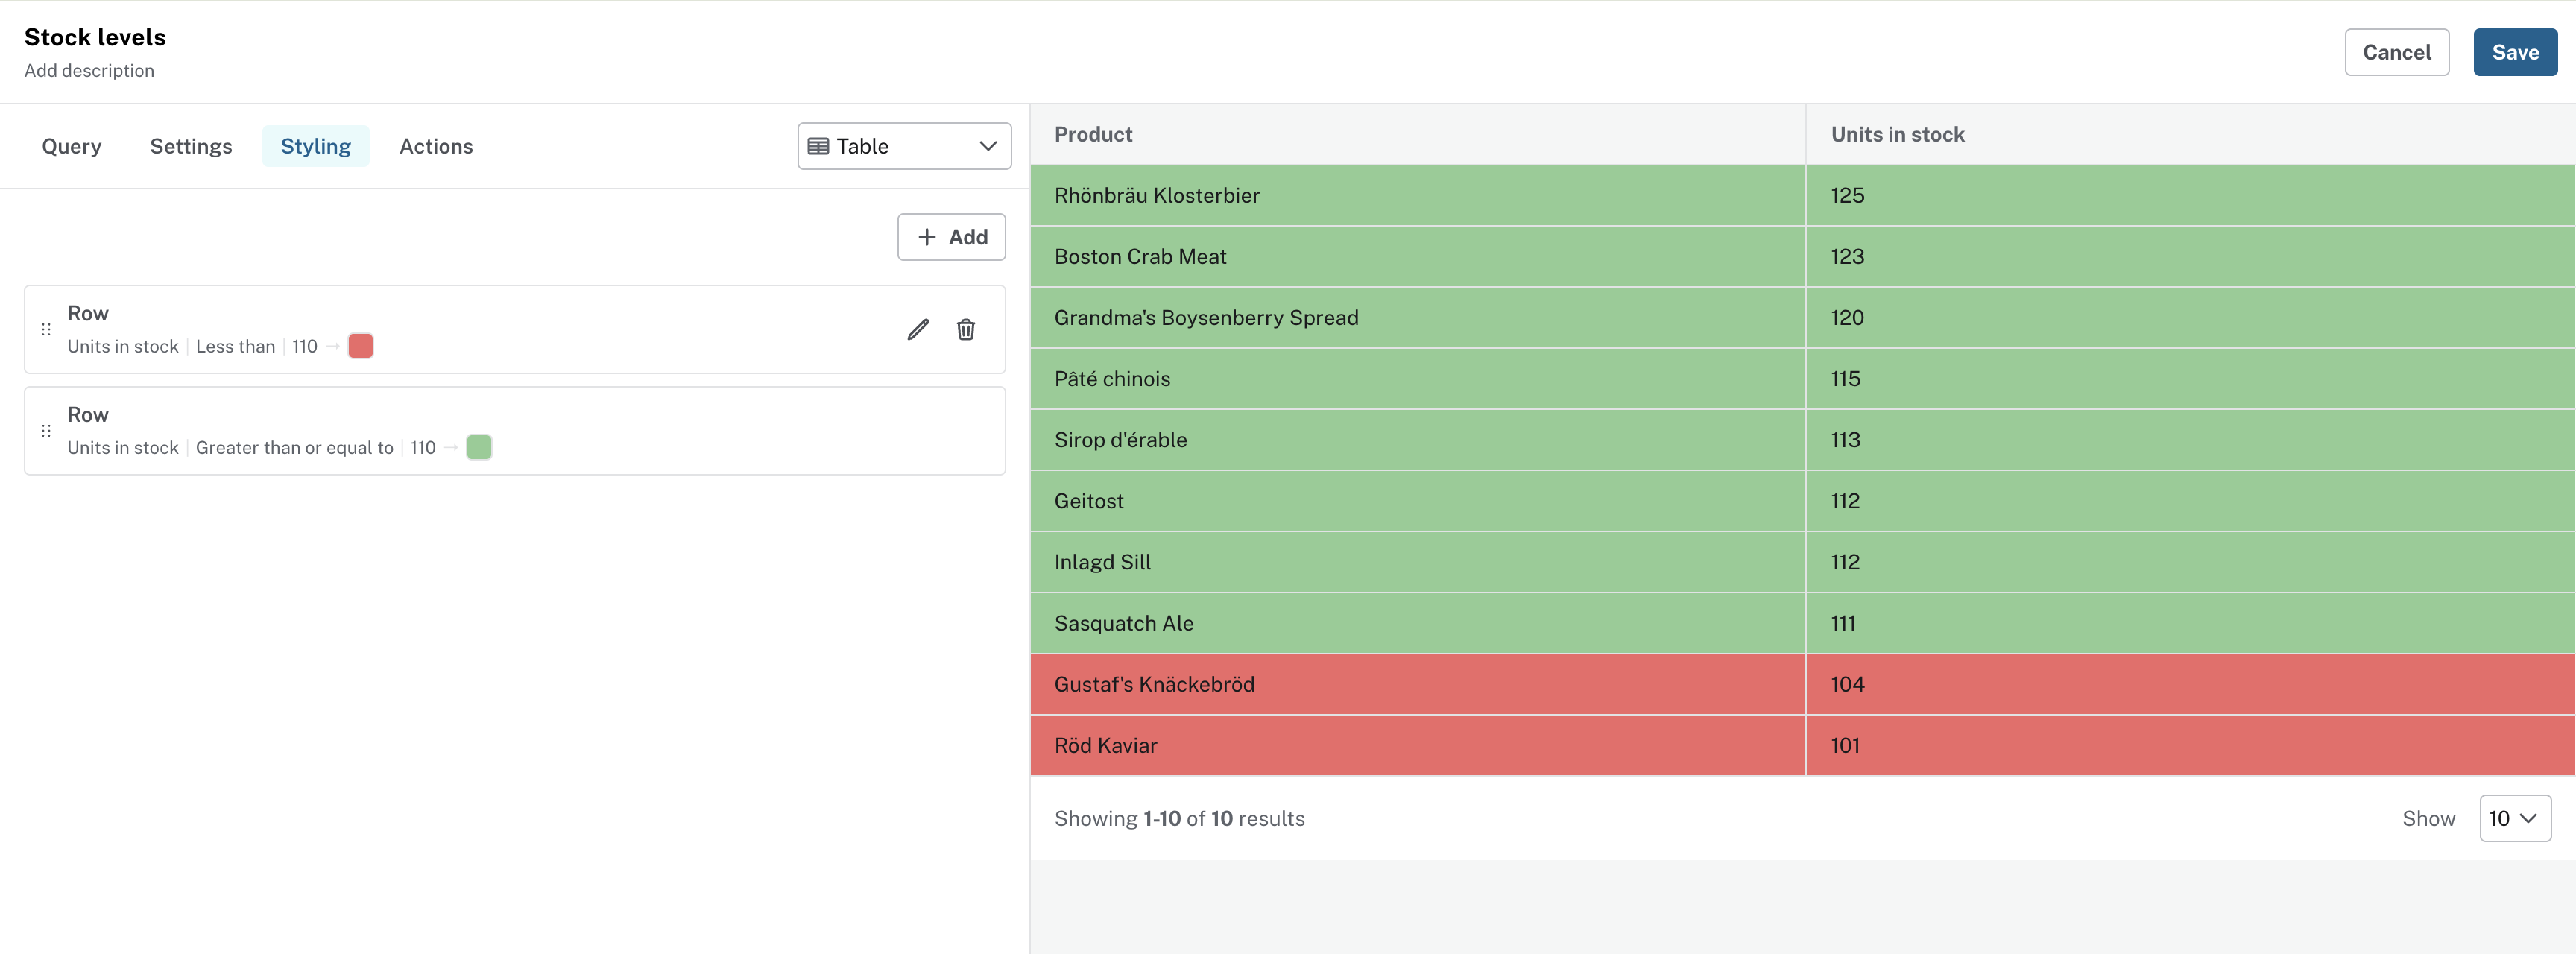
Create another rule that applies a red background to rows where the Units in stock value is less than 110.
Add a color range
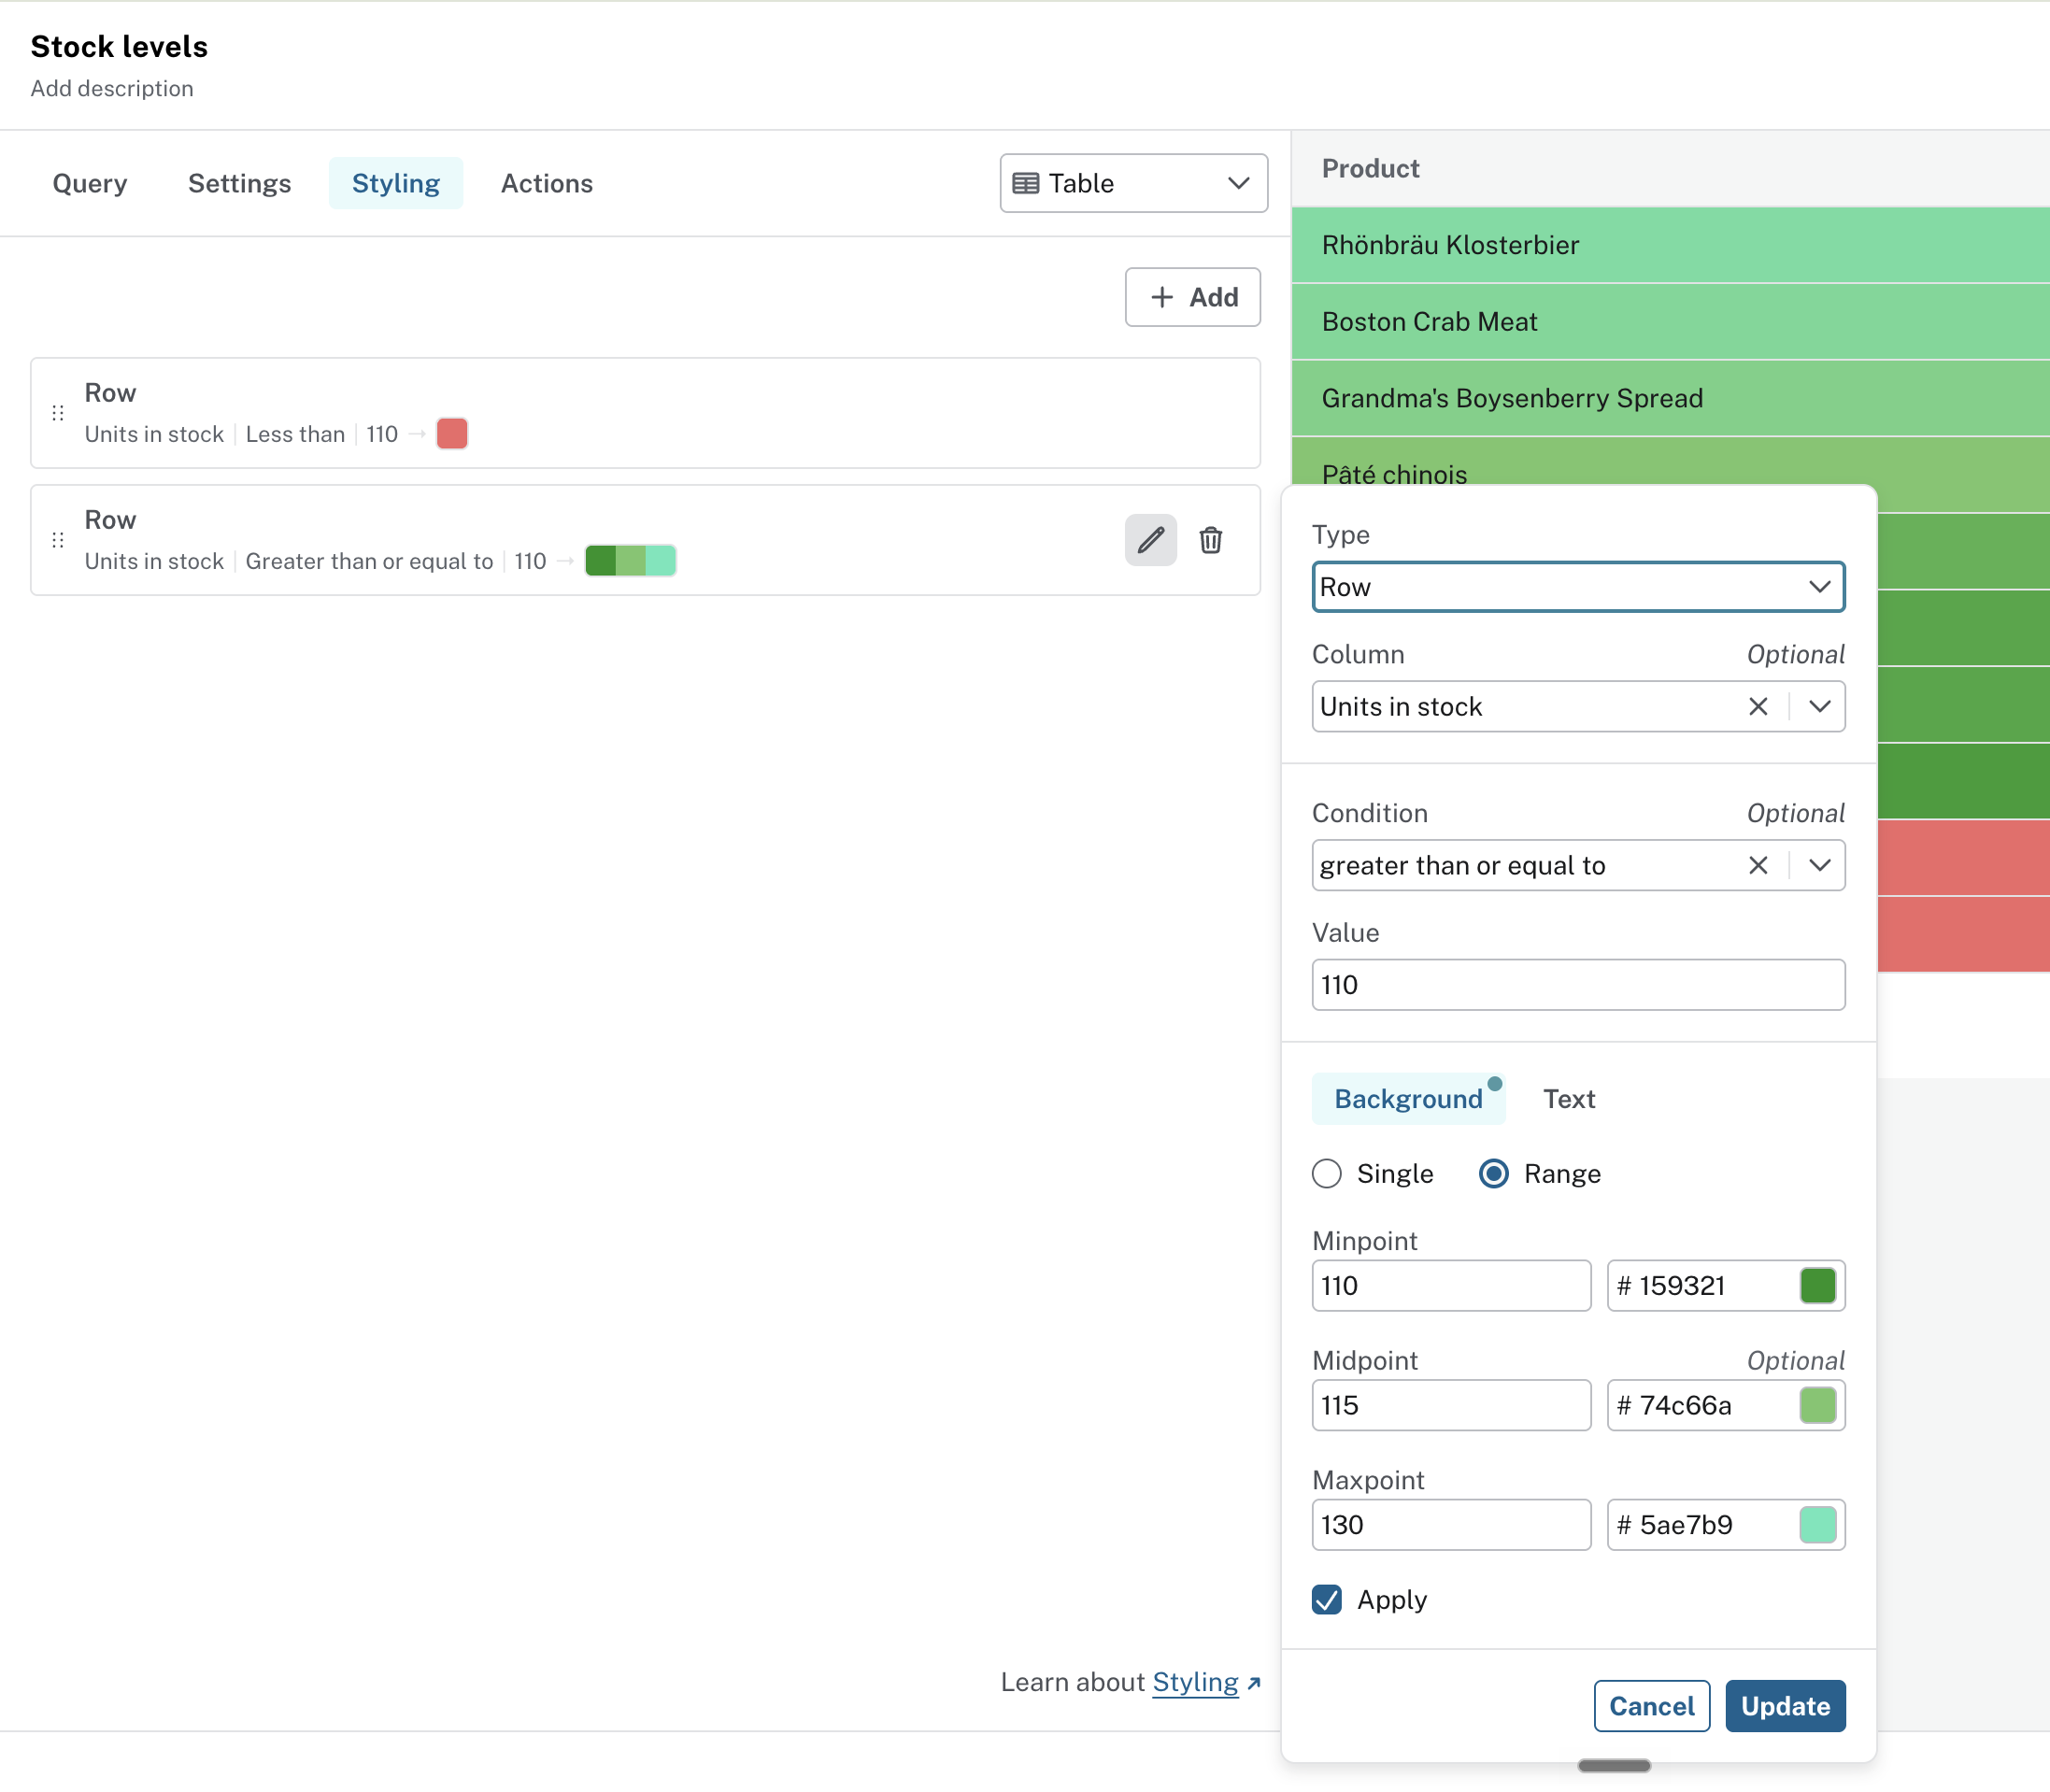
To make differences between the higher stock values more visible, edit the green styling rule and change the background from a single color to a color range. Select the edit icon for the rule.
Set the Minpoint and Maxpoint values and select a color for each.
For example, set the minimum value to 110 with a light green color and the maximum value to 130 with a bright green color.
Values between these points use a blend of the two colors.
Optionally, add a Midpoint of 115 to control the transition between the minimum and maximum.
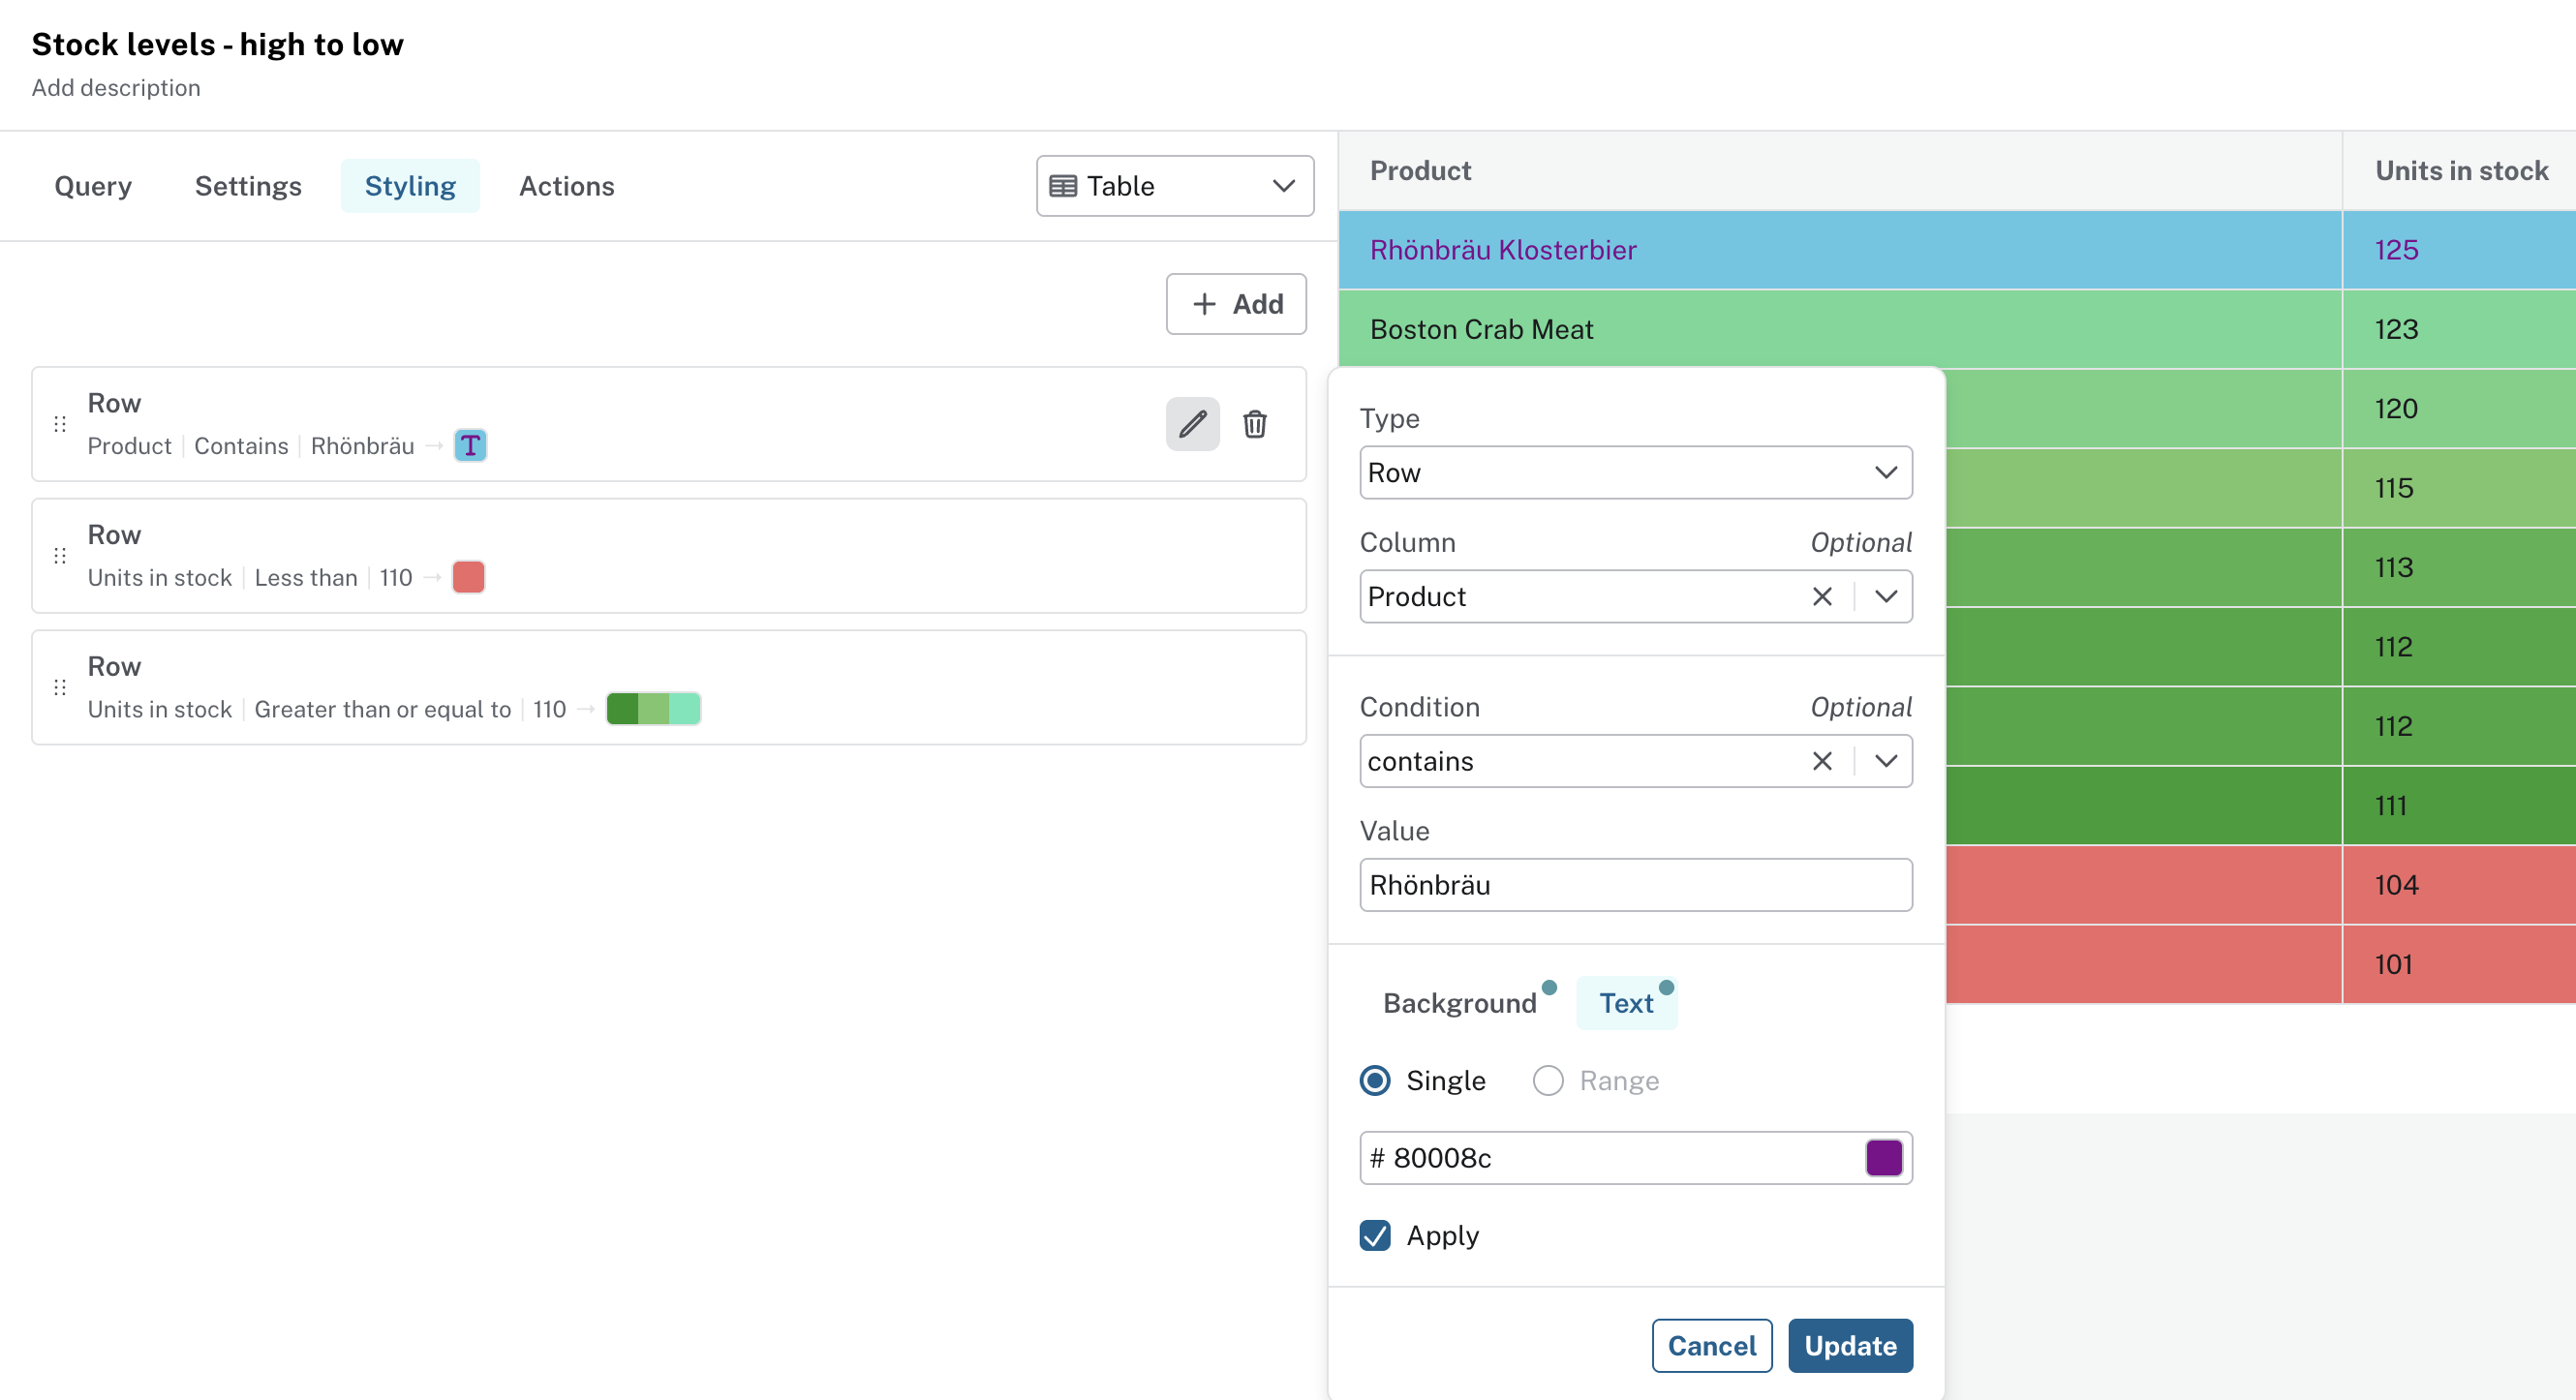
Text color accessibility
When setting a background color, the dashboard automatically picks a light or dark text color to maintain readable contrast. If you set a custom text color rule, this adjustment is skipped, so some combinations may have poor contrast that are hard to read or fail accessibility standards (for example, light gray text on a white background). If you set custom text colors, check the contrast against the background and aim for at least 4.5:1 (W3C Web Accessibility Initiative).