Instances explorer
When you open the Aura console, you can try the new instances explorer with Switch to new instances explorer. You can switch back to the classic view at any time.
This experience makes it easier to get an overview of all instances, both Aura and self-managed, in addition to any Virtual Graphs.
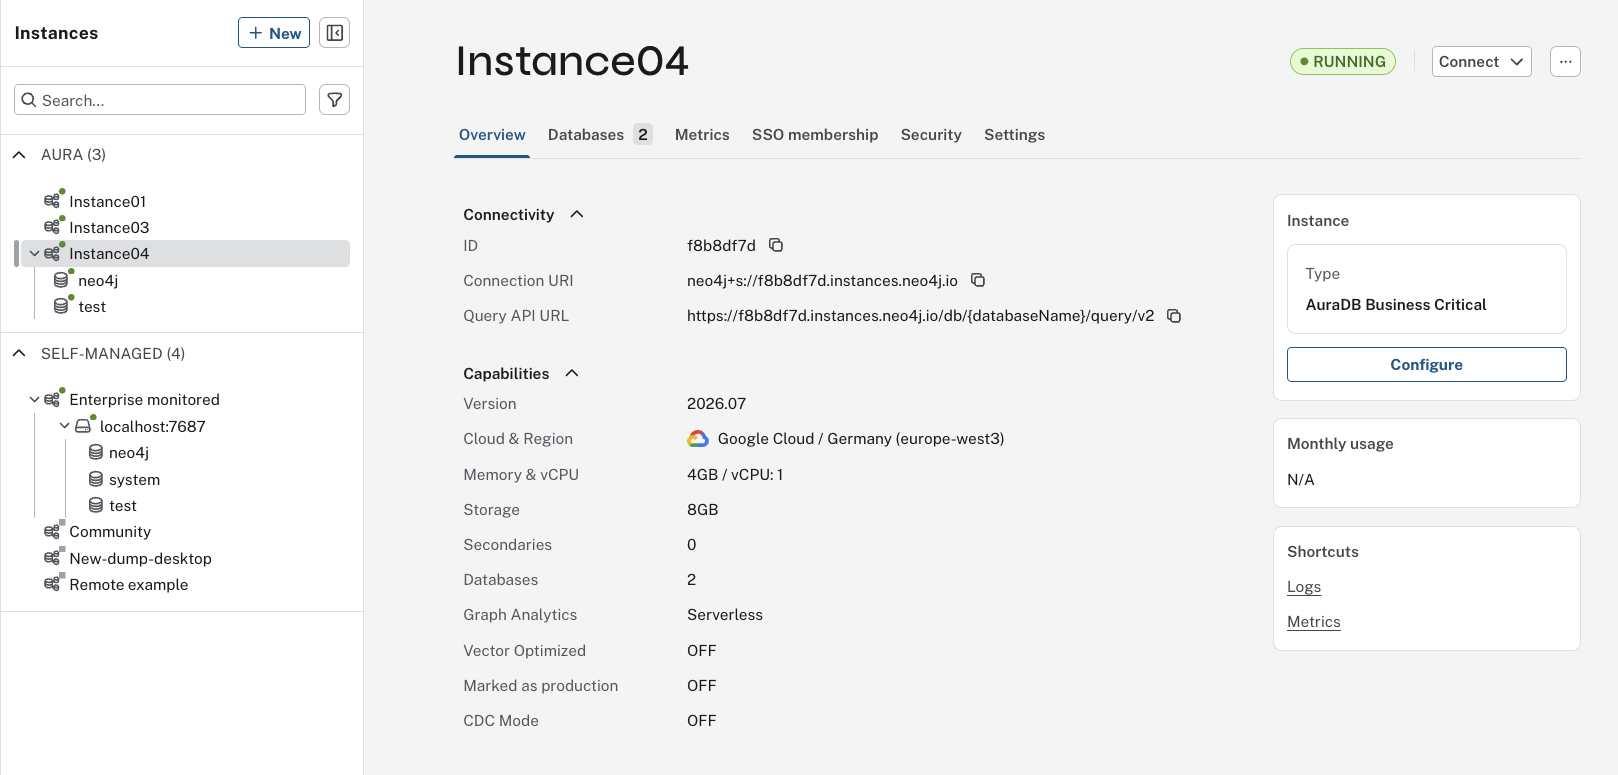
On the left, you can see your existing instances, Aura, self-managed, and Virtual Graphs. Instances have a badge to indicate their status, e.g. running, paused, stopped, etc, and if you hover over it, the status is displayed. You can use the search field or use a filter to find instances. You can filter on:
-
Status (running, paused, offline, unmonitored, degraded, or creating/destroying)
-
Tier
-
Issues (with license or plugin)
This panel is also where you can create new Aura instances, connect self-managed instances, or create Virtual Graphs.
Aura instances
Selecting an instance from the list on the left displays its details in the main frame. The first tab is Overview and this corresponds to the equivalent tab when you Inspect from the instance card in the classic view. See Instance details for a closer description.
If an instance has multiple databases enabled, a Databases tab contains a table of the existing databases. You can create additional databases from this tab. See Create databases for more information. If you select a database on a multiple database instance, its details and options for backups and restore can be navigated in the main frame.
Under the Snapshots tab, you find available snapshots, as described in Snapshots. Note that the Snapshots tab is not available for multi-database instances, where backups are handled on a per-database basis, as described above.
Restore from file allows you to restore a database to your instance, see Restore from backup file. Note that the Restore from file tab is not available for multi-database instances, where restores are handled on a per-database basis, as described above.
Metrics are available via the dropdown in the classic view, but in the instance explorer, you access them from the Metrics tab instead. Use View all metrics to see all available metrics. See View metrics for more information.
SSO membership shows details about single sign-on for the instance, if set up. See Single Sign-On for more information about SSO.
Security allows you to configure custom endpoints. The instance explorer allows you to configure custom endpoints directly from the instance view, rather than via Project → Settings → Custom endpoints, although it is still possible to use that route. See Custom endpoints for more information on this feature. Note that the Security tab is not available for AuraDB Free instances.
In the Settings tab, you can rename your instance, clone, and delete the instance. On instances with multiple user databases, the Settings tab also includes options for restoring the instance and creating a restore point. See Multiple database instance restore for more information.
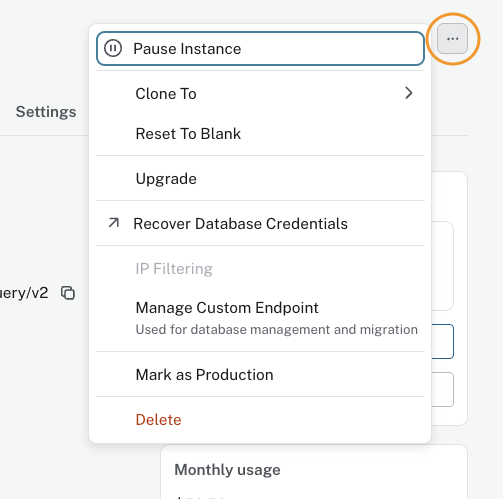
Additionally, instance actions are available from the […] menu in the top right corner of main frame. These are described in detail in Instance actions.
Self-managed deployments
Self-managed deployments can contain multiple servers, and each server contains multiple databases by default and the instances explorer’s hierarchy reflects this. The top level is the deployment, followed by one or more servers, and each server contains at least two databases.
Deployment
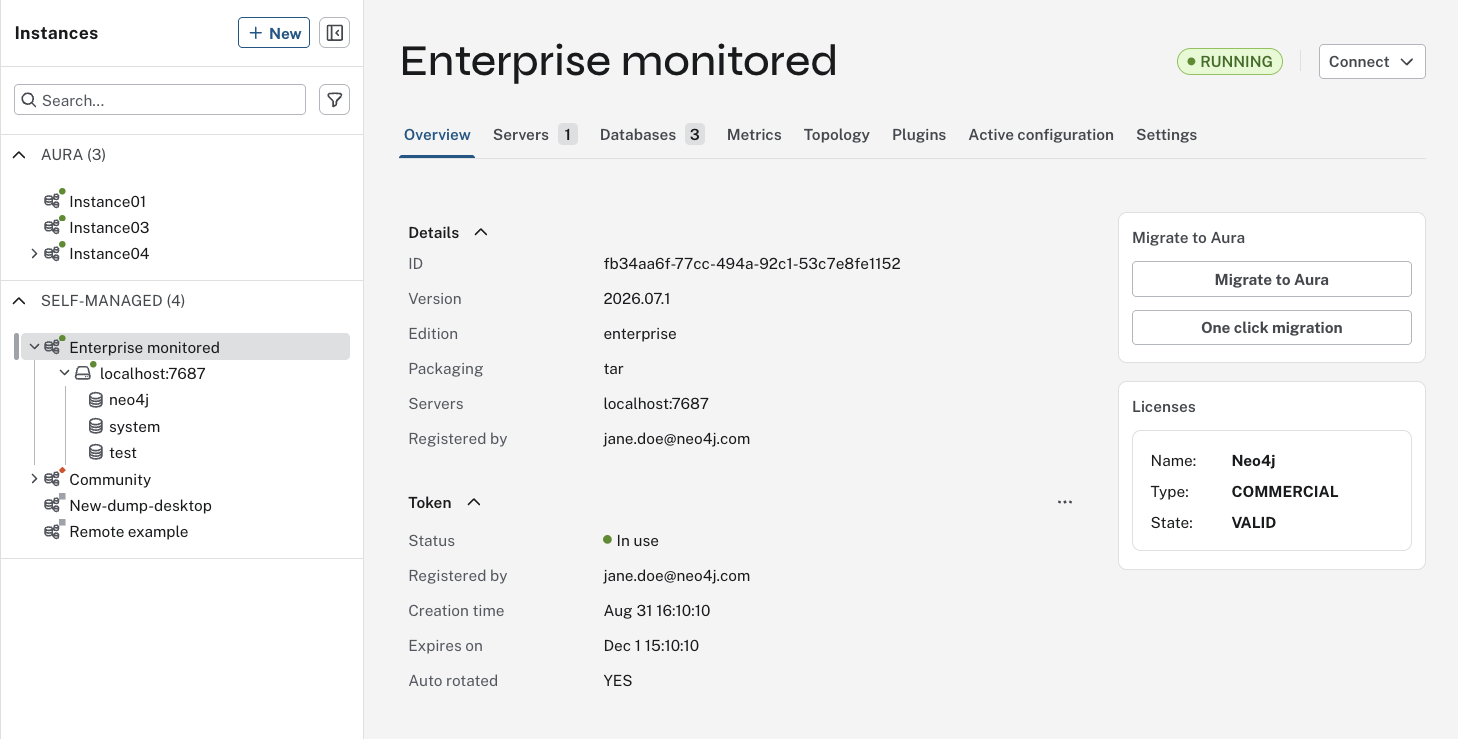
If you select a deployment, the first tab in the main frame is Overview. This corresponds to using the […] menu on the instance card to Inspect the details, in the classic view. See Inspect deployment for details.
The Servers tab indicates how many servers exist in the deployment. The table shows information about them. See Servers for more information.
The Databases show corresponding information about the databases in the deployment, as described in Databases and Database instances.
Metrics contains the same three metrics as the classic experience, CPU Usage, Storage, and Query Rate. Metrics are not available for Neo4j Community Edition. Use View all metrics to see all available metrics. See View metrics for more information.
Topology is a graph view of your deployment and it corresponds to the Show details in the […] menu in the classic view. See Graph view to learn more.
The Plugin tab lists any available plugins in the deployment.
Active configuration shows the effective server configuration settings per server for the deployment.
This can be inspected from the […] menu in the classic view, and is described in Active configuration.
For more information on configuration settings for self-managed deployments, see Operations Manual → The neo4j.conf file.
The Settings tab includes options for updating name and connection URL for the deployment as well as options for logging. You can also unregister the deployment from Fleet Manager, which removes the deployment from the instances explorer in the Aura console. The deployment is not stopped nor deleted, only not connected to the Aura console anymore.
Server
If you select a server in a deployment, information about the server is available in the Overview tab.
The Database instances tab shows a table view of the databases/database instances hosted on the server. See Databases and Database instances for more information.
The Plugin tab lists available plugins on the server.